East Collin County
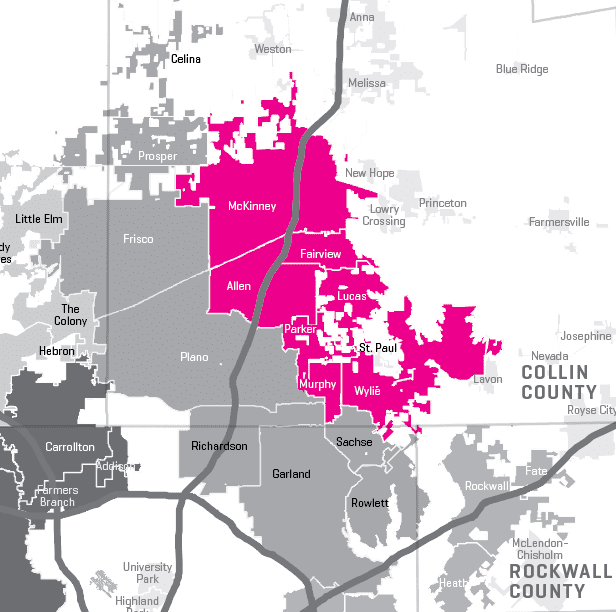
East Collin County
Collin County is a unique blend of new leading edge urban mixed with traditional, a great quality of life with a business/technology friendly environment. Collin County is one of the fastest growing counties in Texas and the nation. More than 900,000 people, a rapidly growing list of corporate headquarters, and two professional sports teams have chosen this part of North Texas as home. Two large communities – Allen and McKinney – make up East Collin County. This area is home to Allen Premium Outlets, Waters Creek, the Heard Museum, and historic downtown McKinney.
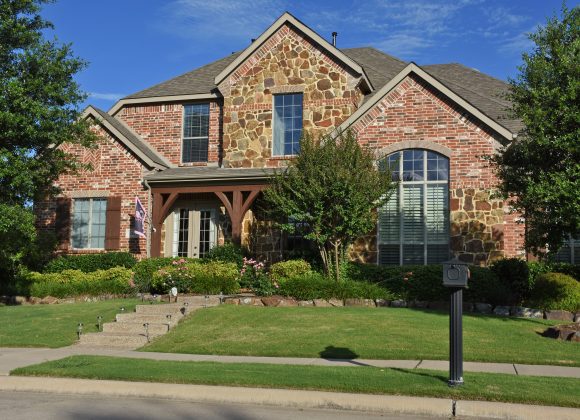
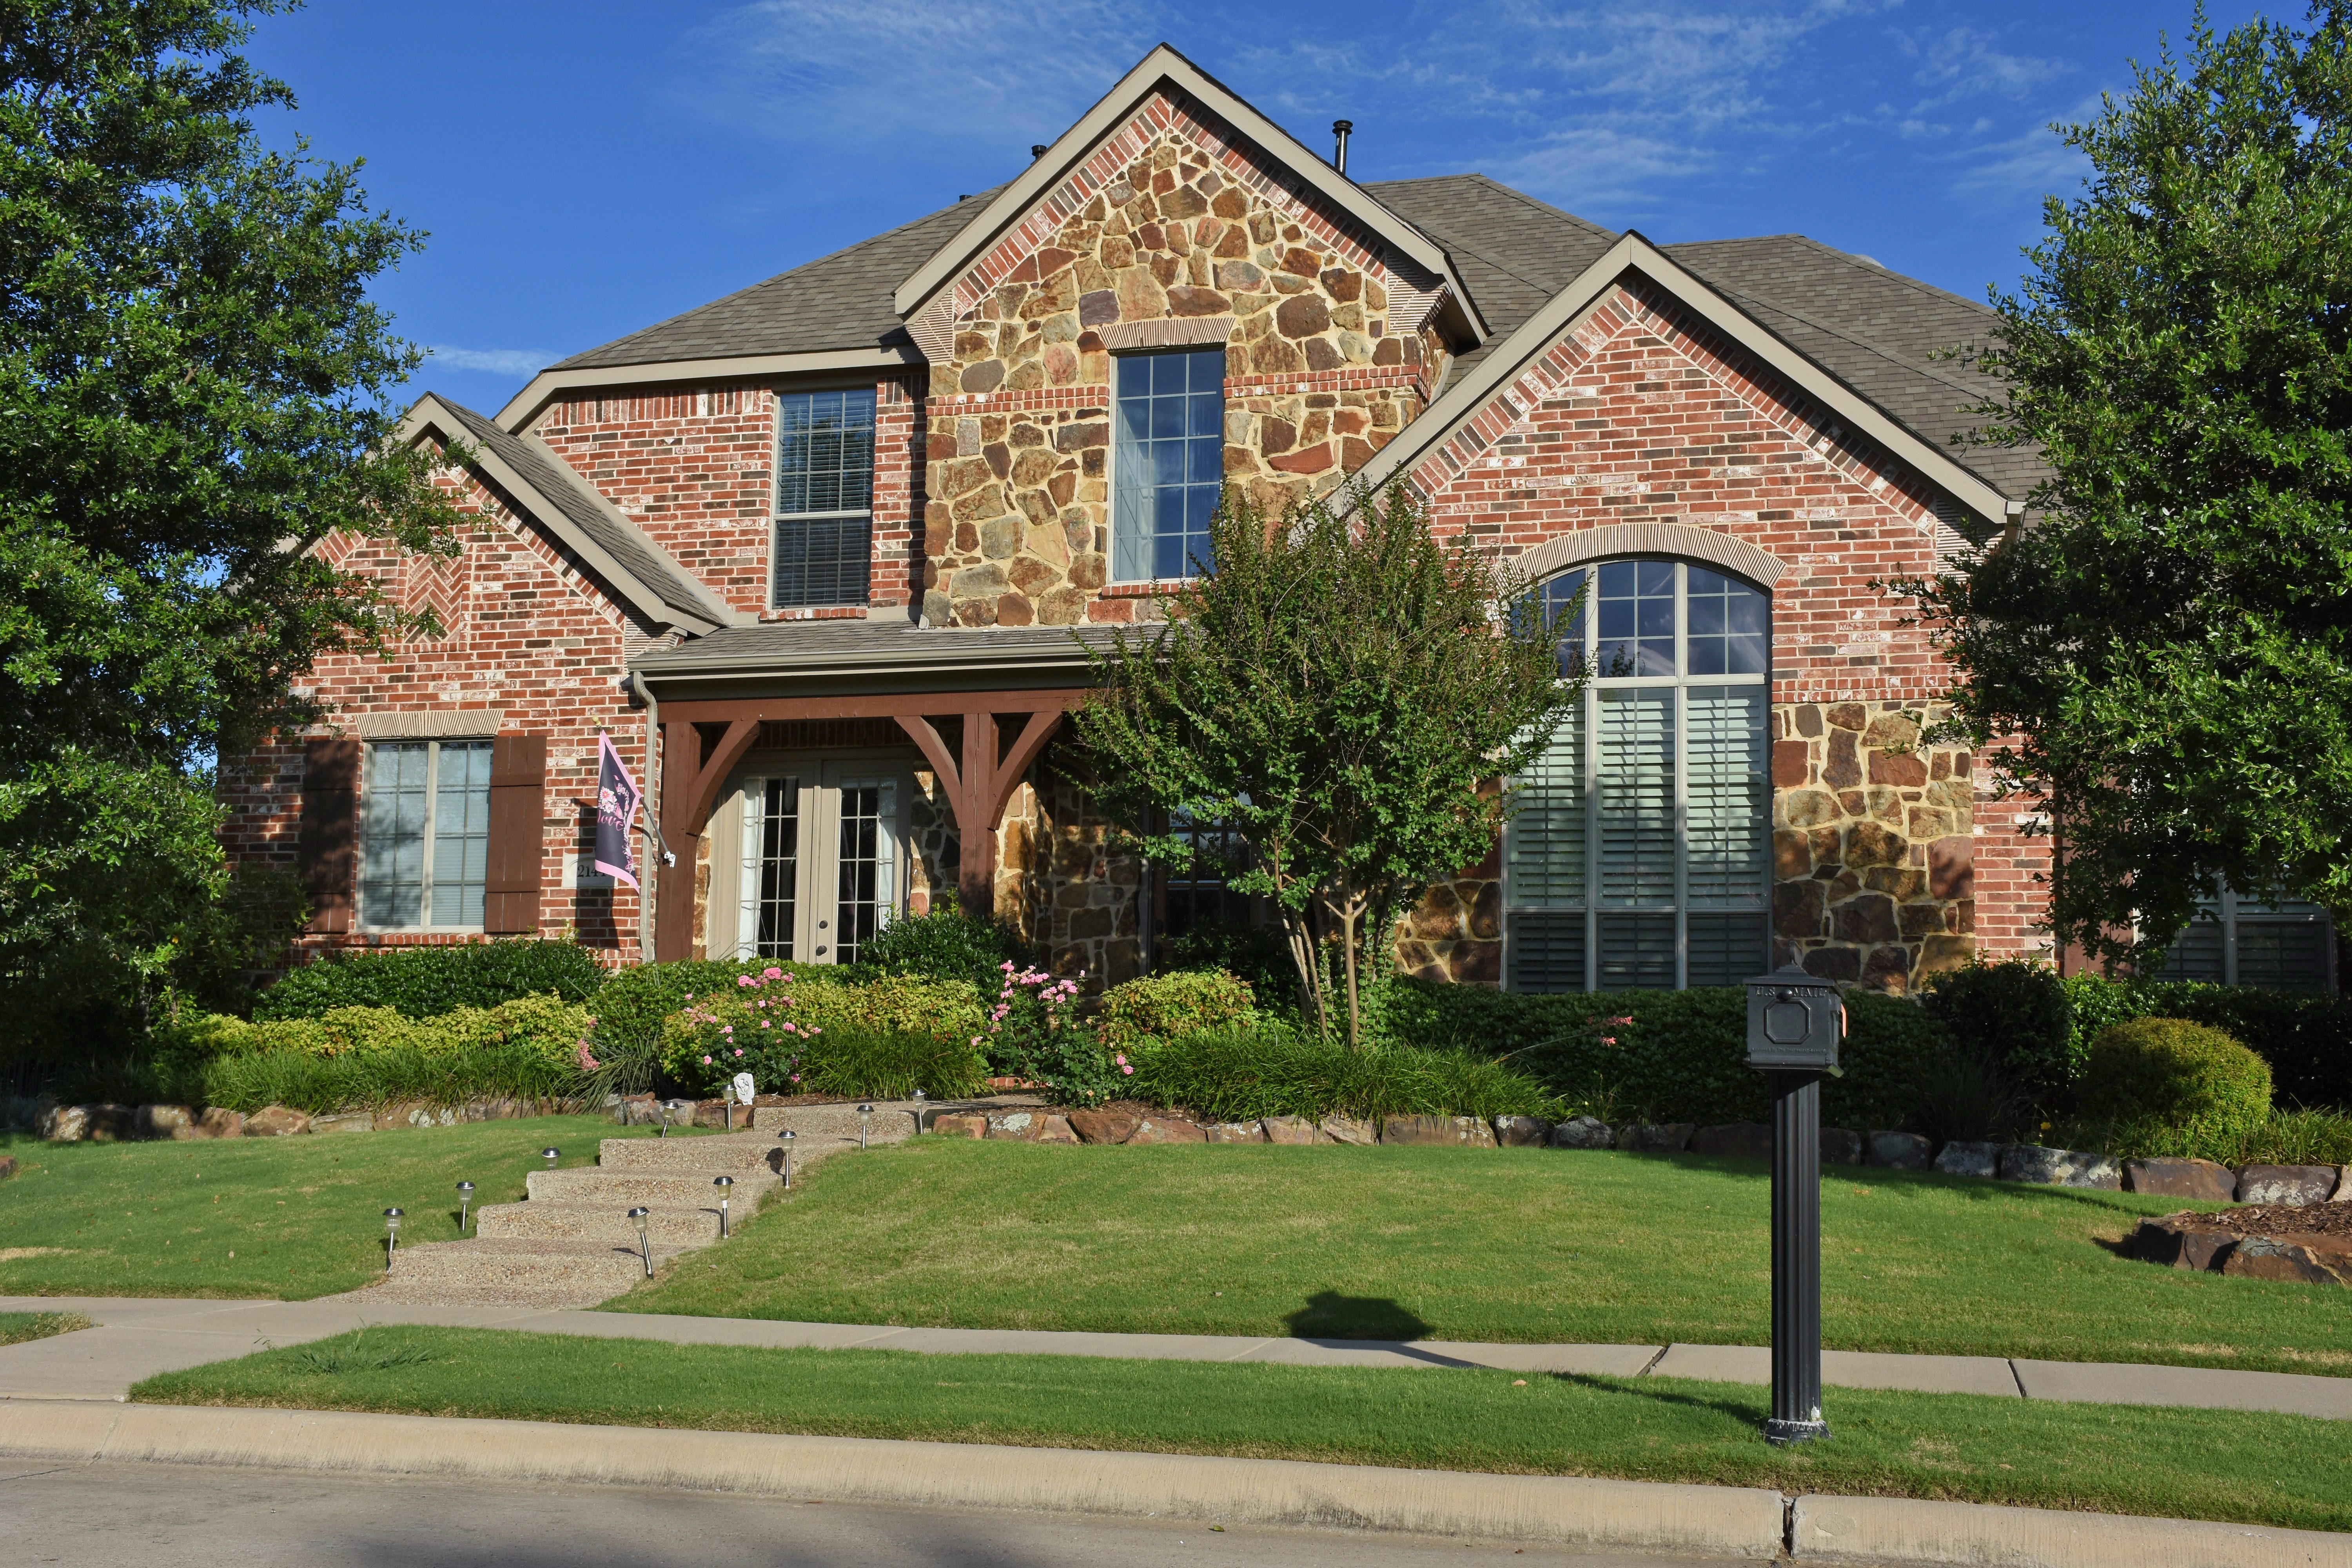
Allen Star Creek Home 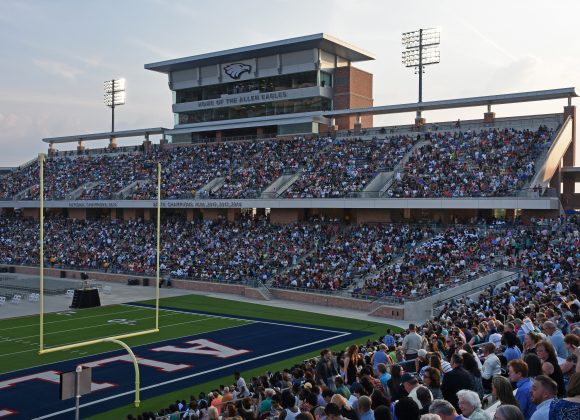
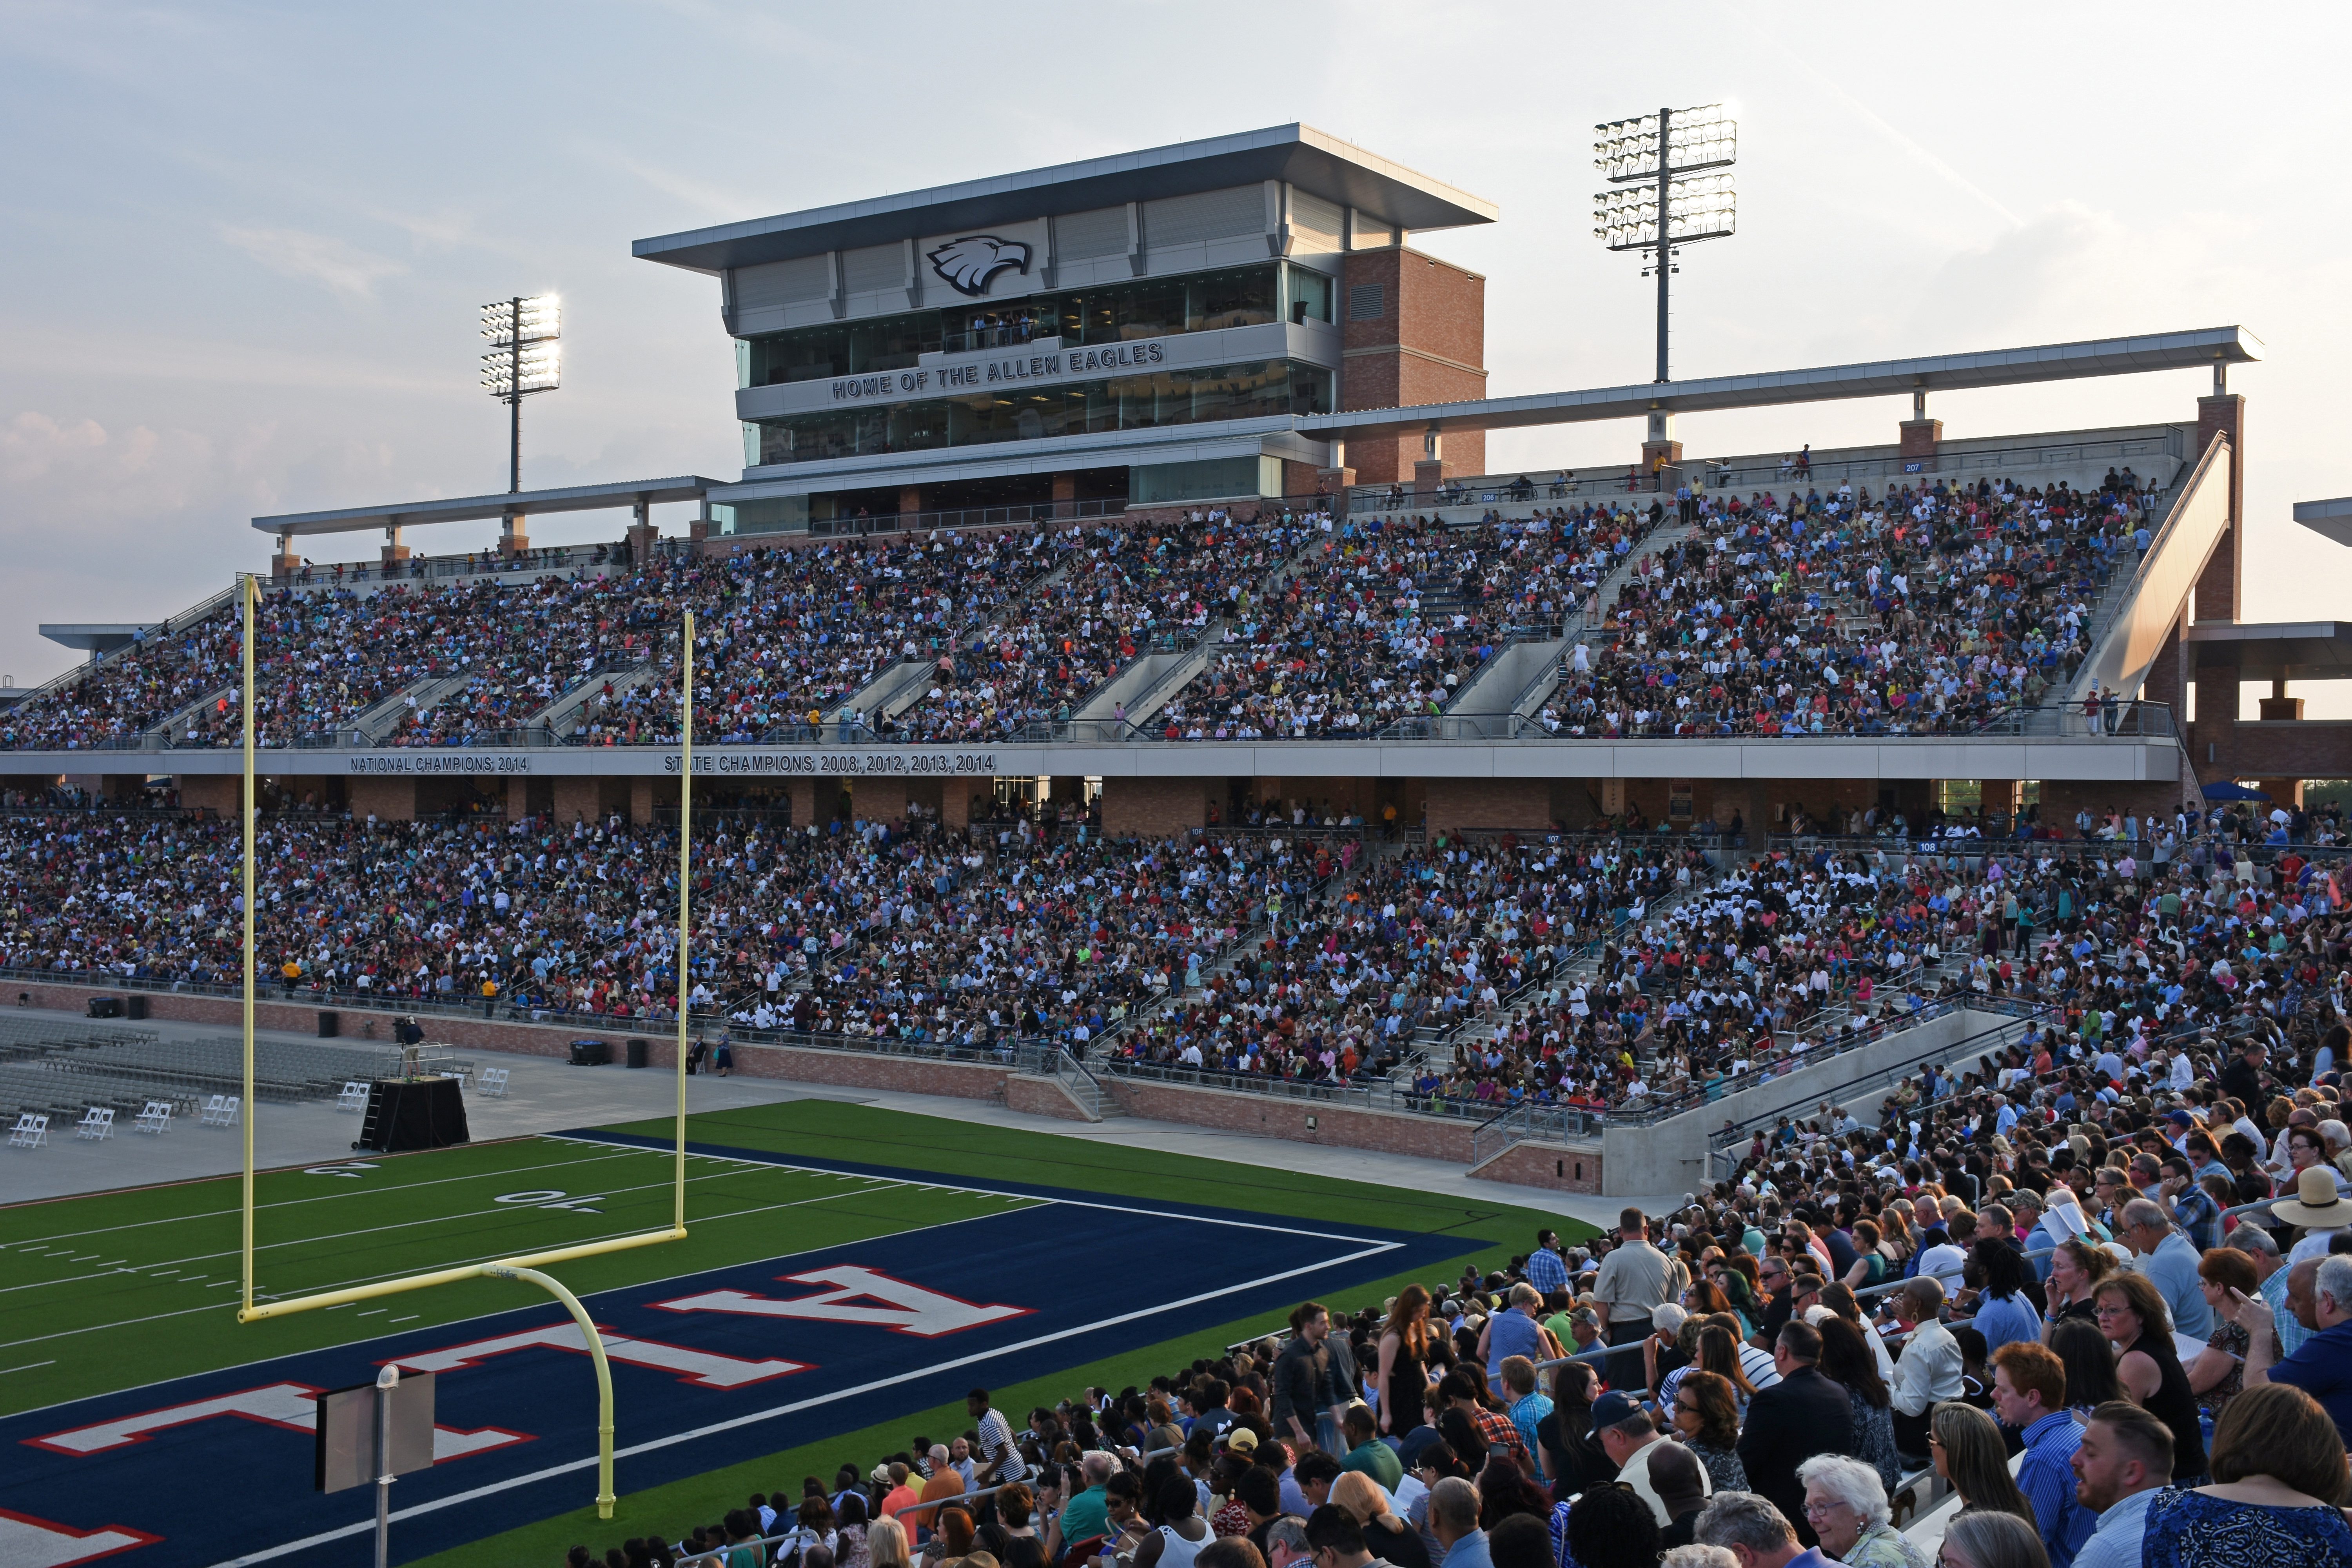
Allen Eagle Stadium 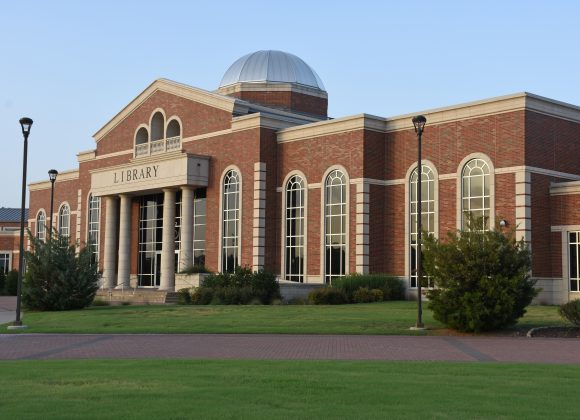
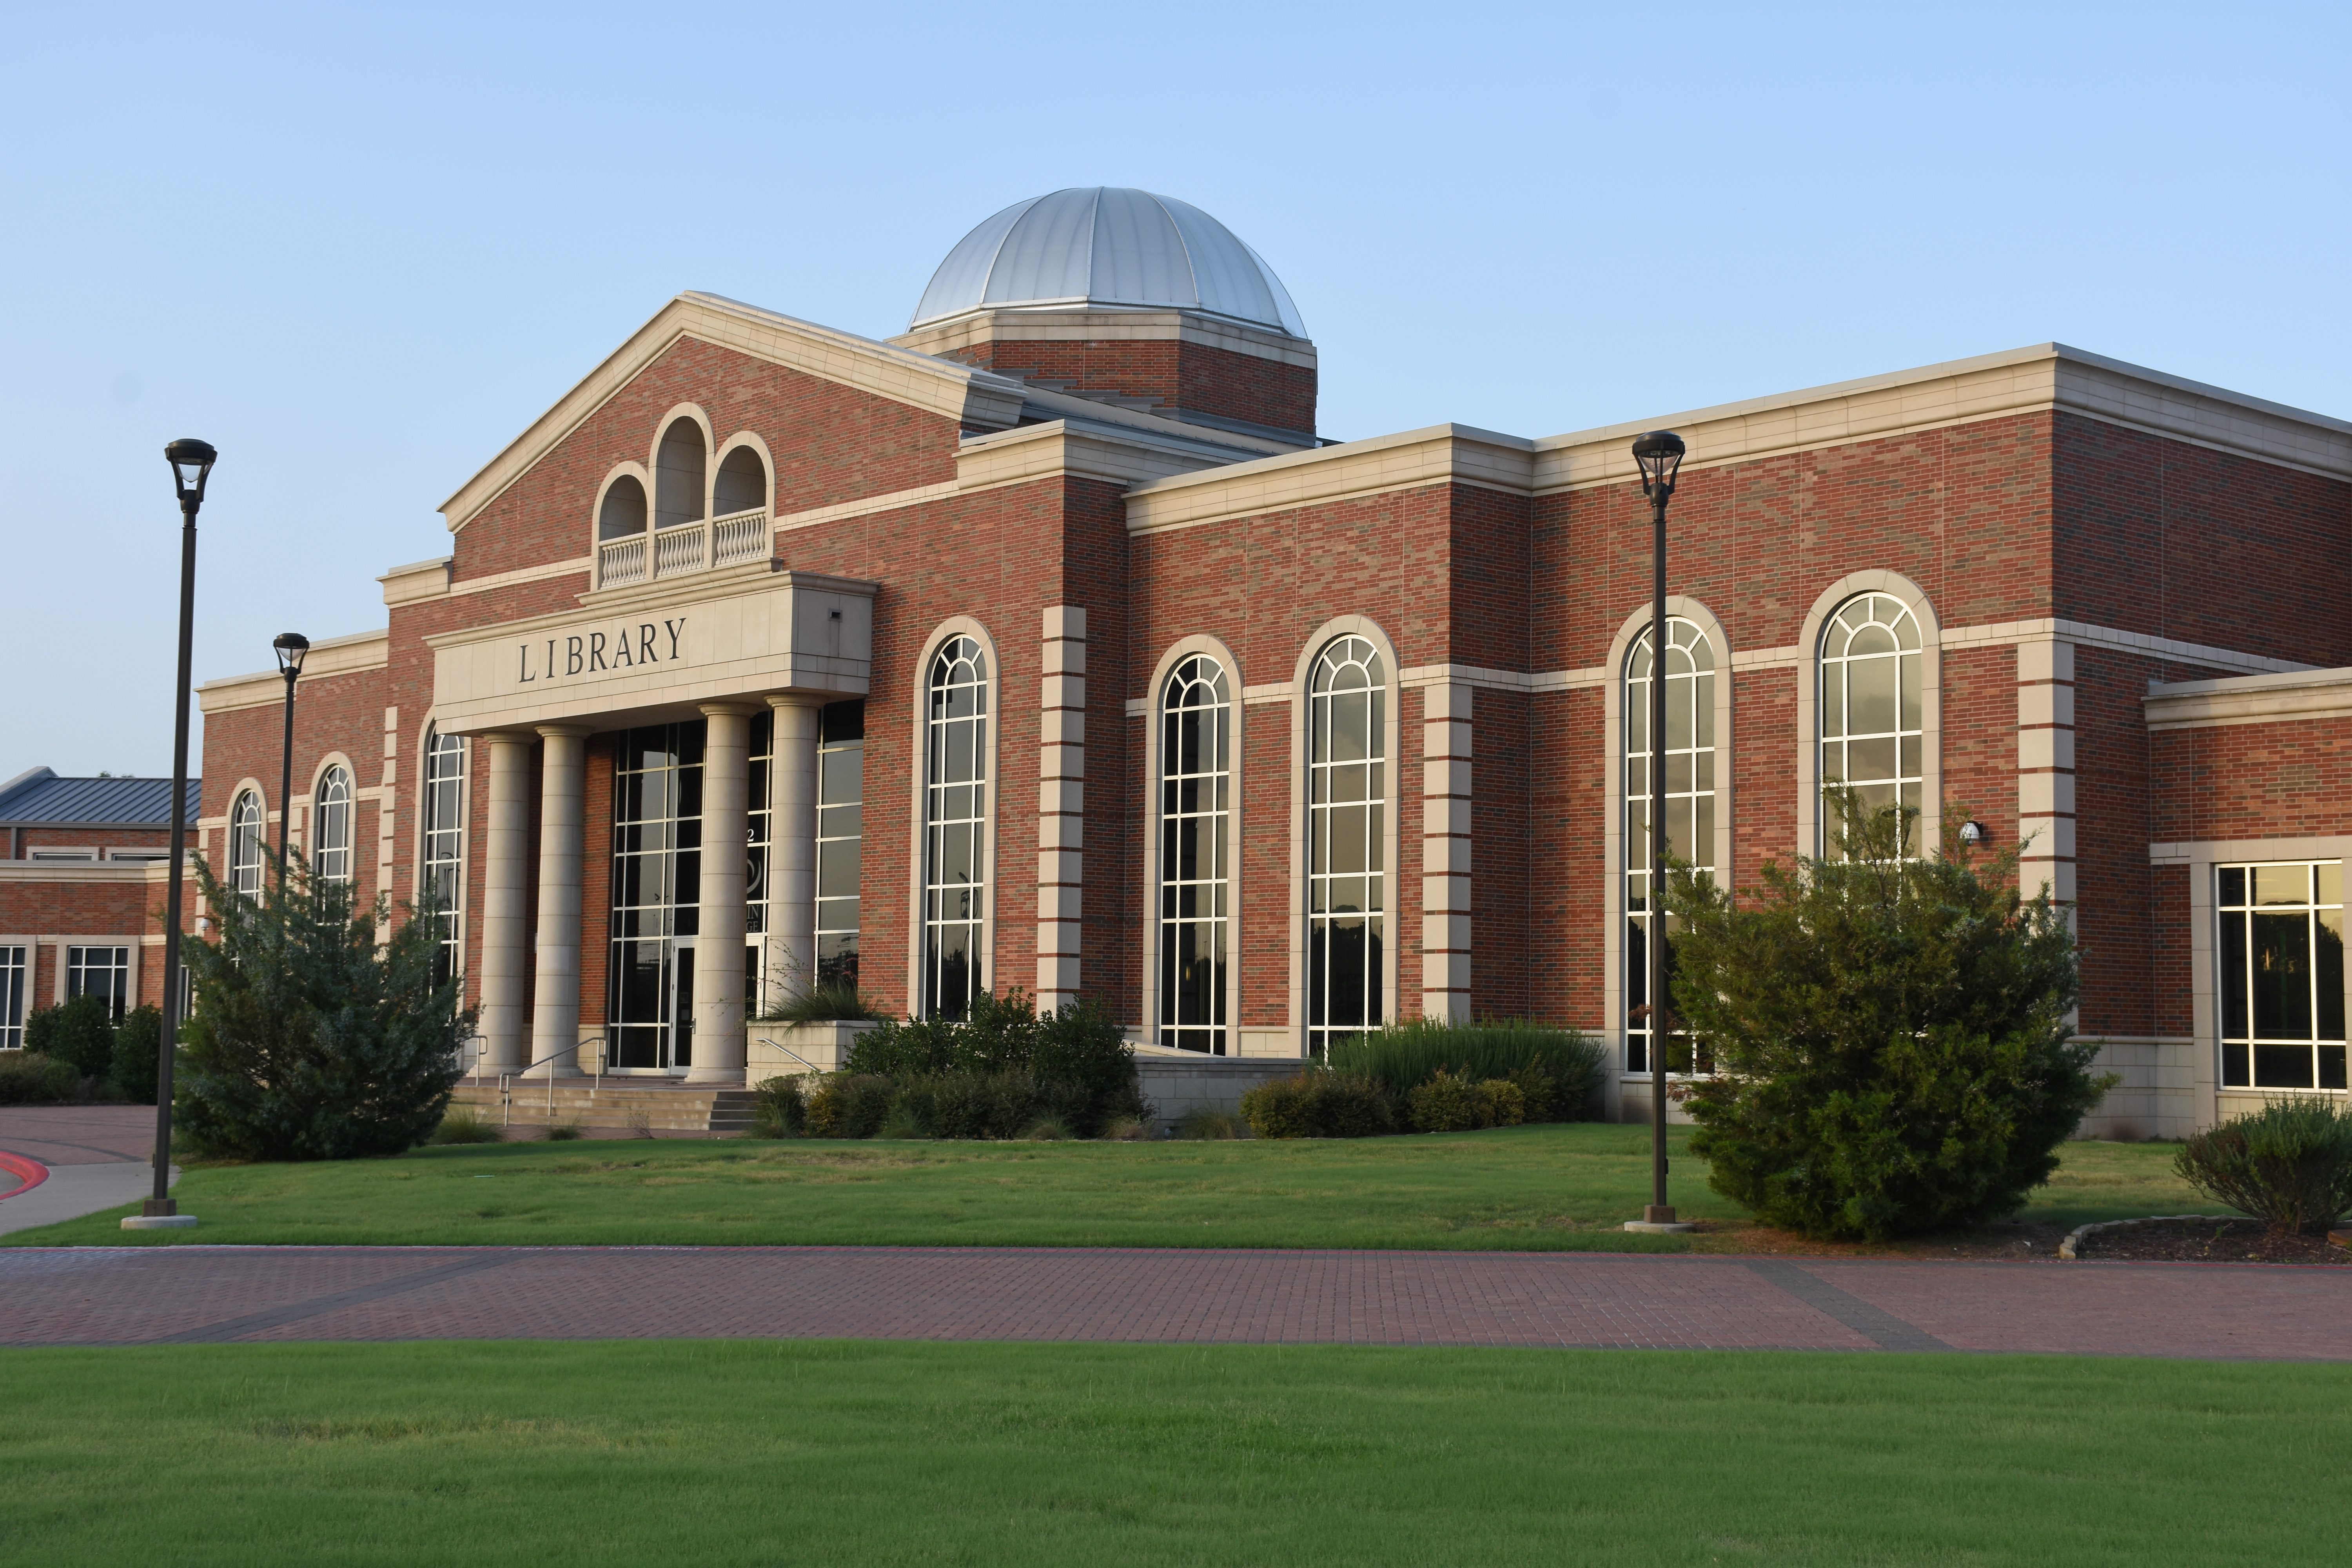
Collin College 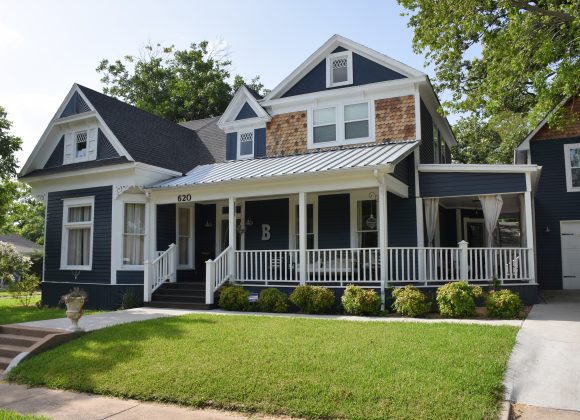
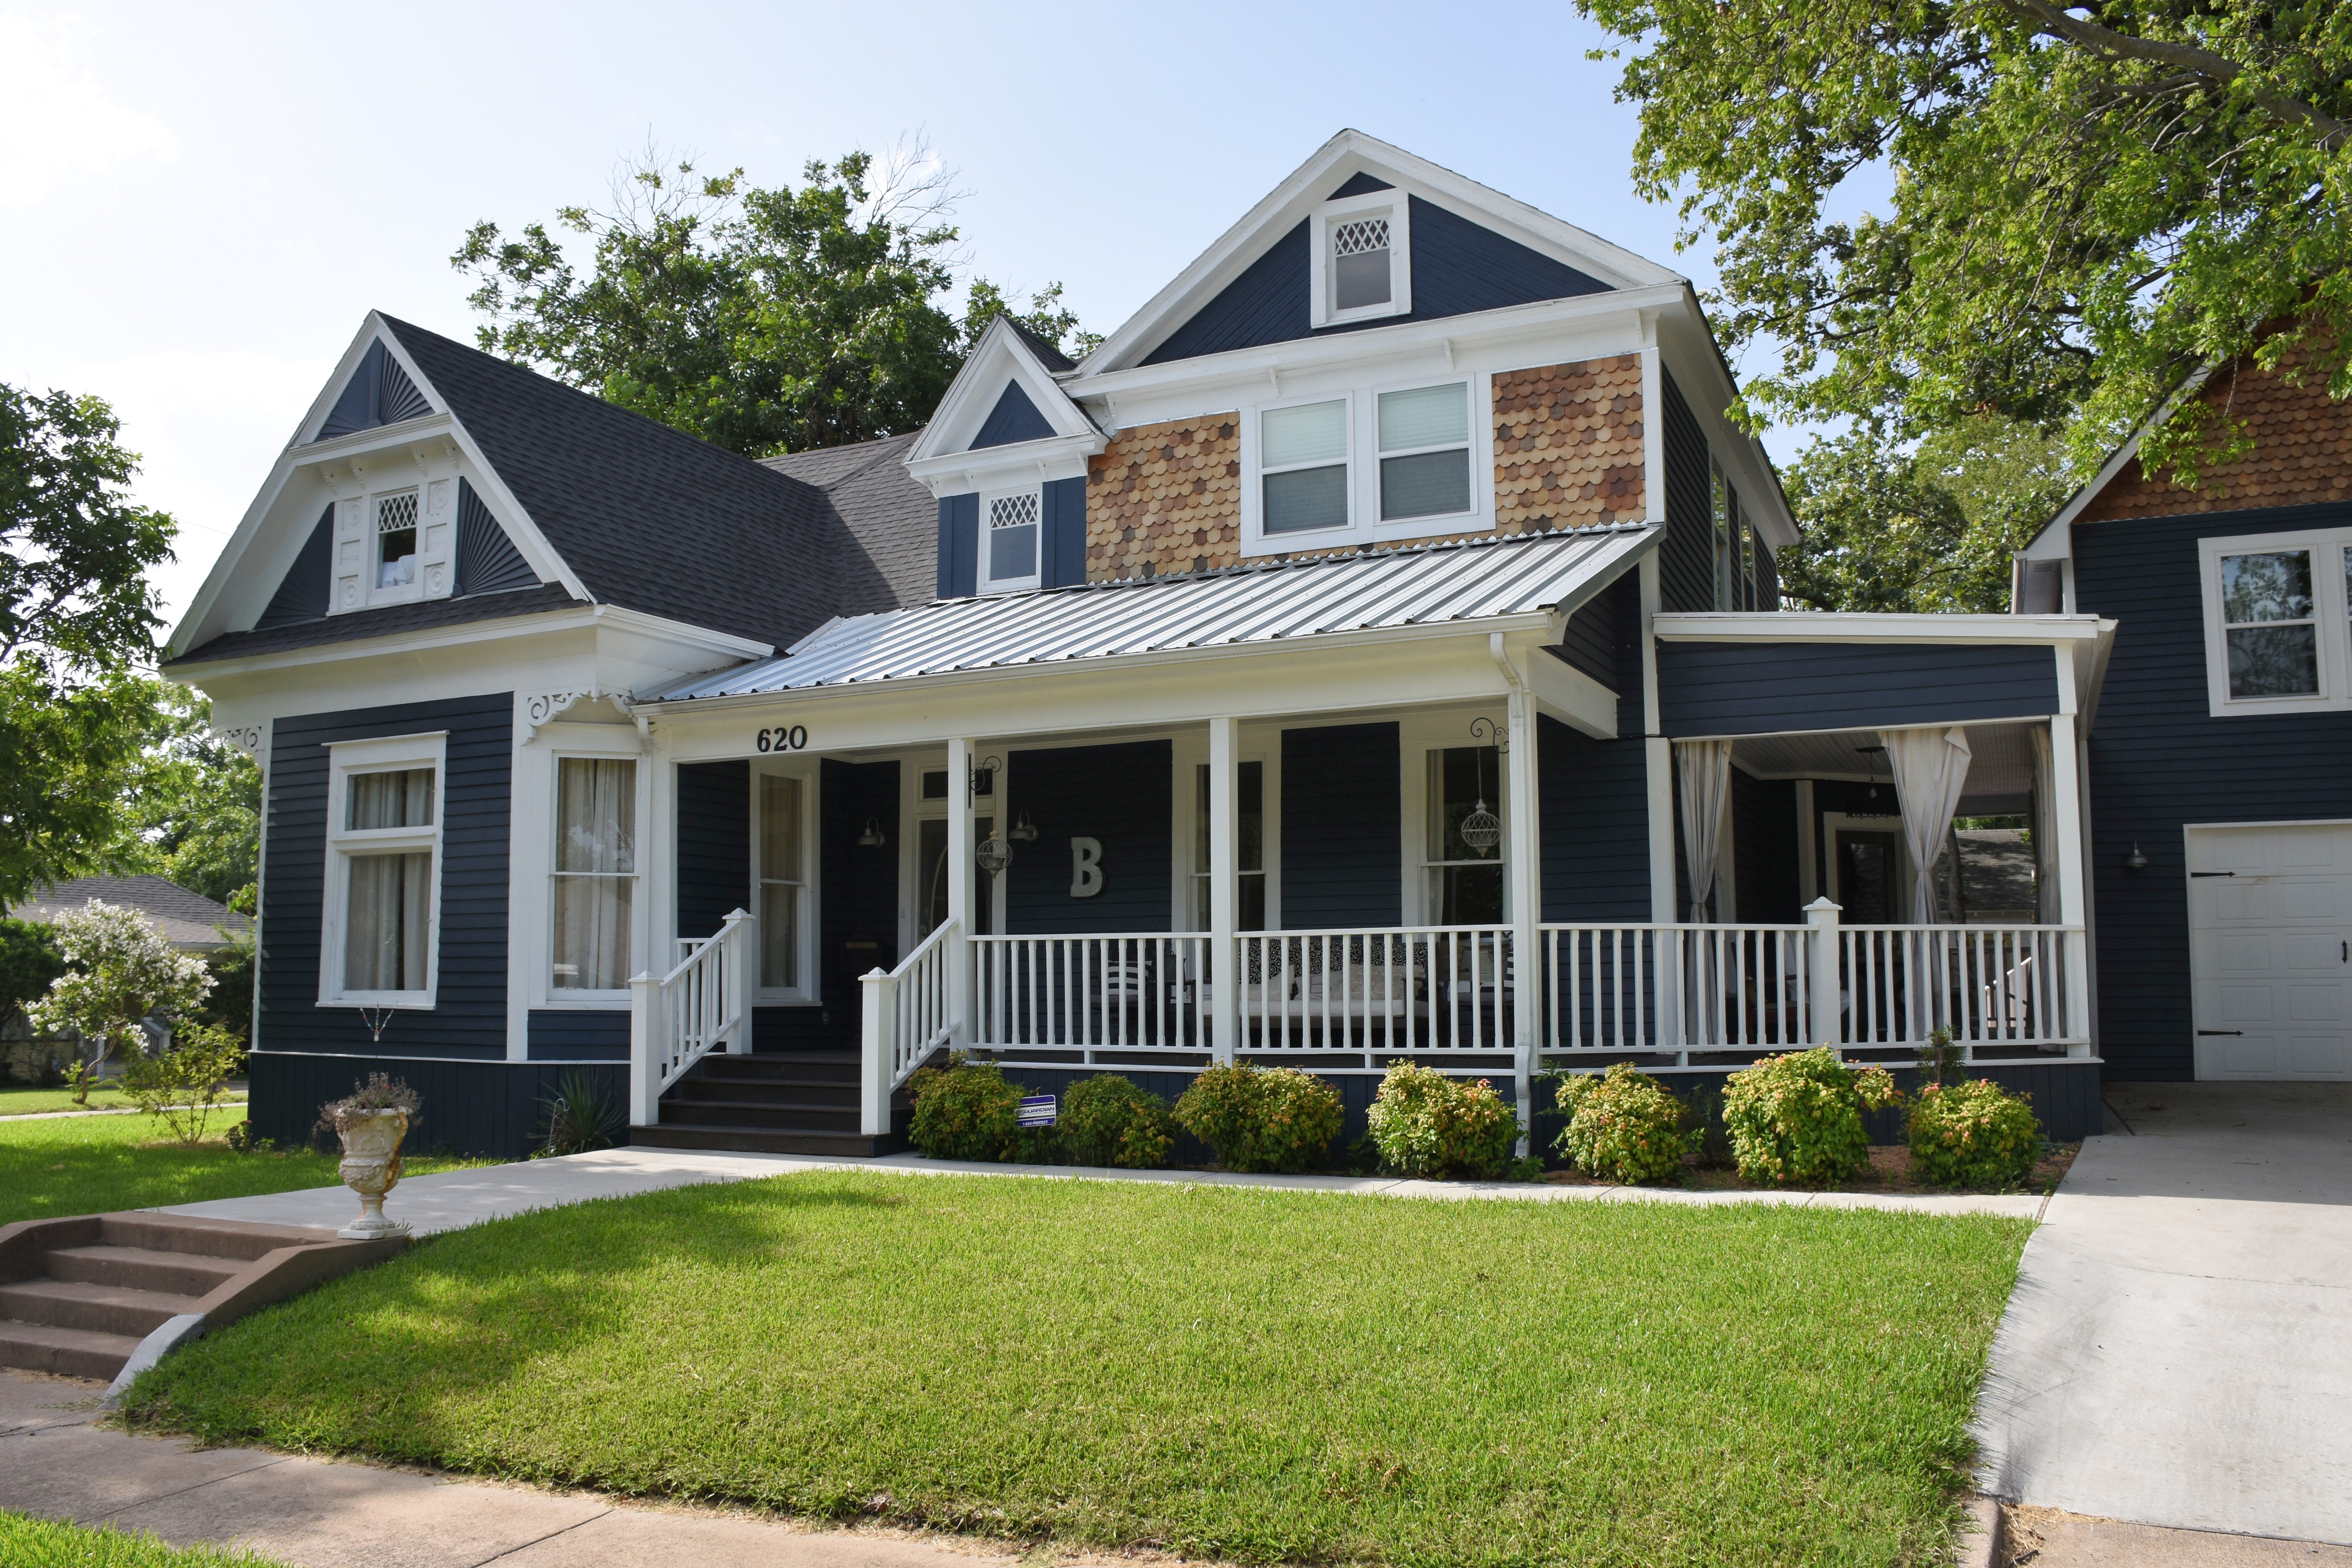
McKinney Historic Home
By The Numbers
| 2017 | 2022 | |
|---|---|---|
| Population | 362,664 | 417,642 |
| Households | 119,242 | 137,036 |
| Average Household Size | 3.02 | 3.03 |
| Media Age | 34.7 | 34.8 |
| Median Household Income | $96,519 | $103,788 |
| Average Household Income | $118,113 | $132,458 |
| Per Capita Income | $39,056 | $43,653 |
Educational Attainment (Population 25+)
| 2017 | |
|---|---|
| TOTAL | 226,013 |
| Less Than 9th Grade | 2.8% |
| 9th-12th Grade, No Diploma | 3.0% |
| High School Graduate | 13.5% |
| GED/Alternative Credential | 2.3% |
| Some College, No Degree | 20.2% |
| Associate Degree | 8.4% |
| Bachelor’s Degree | 33.8% |
| Graduate/Professional Degree | 16% |
Race and Ethnicity
| 2017 (%) | 2022 (%) | |
|---|---|---|
| White Alone | 247,752 (68.3%) | 267,368 (64.0%) |
| Black Alone | 40,824 (11.3%) | 51,595 (12.4%) |
| American Indian Alone | 2,176 (0.6%) | 2,406 (0.6%) |
| Asian Alone | 39,663 (10.9%) | 56,519 (13.5%) |
| Pacific Islander Alone | 282 (0.1%) | 375 (0.1%) |
| Some Other Race Alone | 19,341 (5.3%) | 23,060 (5.5%) |
| Two or More Races | 12,624 (3.5%) | 16,317 (3.9%) |
| Hispanic Origin (Any Race) | 56,627 (15.6%) | 68,897 (16.5%) |