East Dallas Area

East Dallas Area
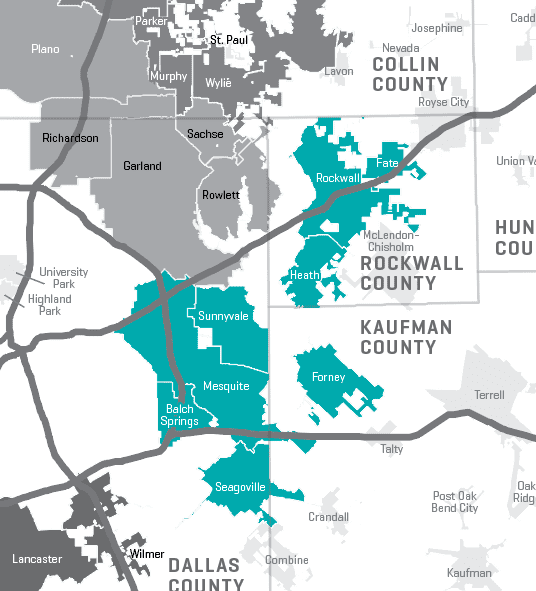
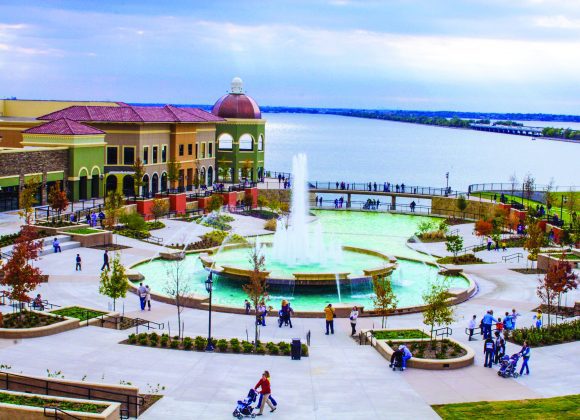
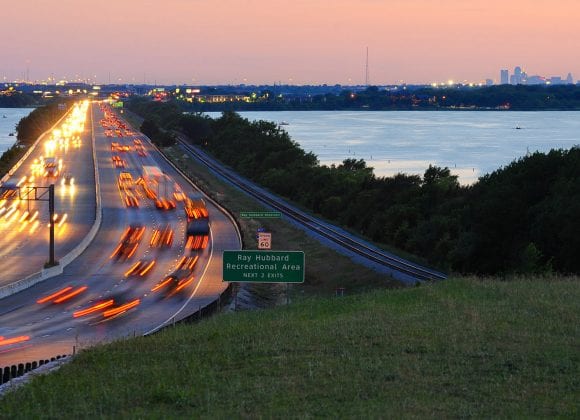
The East Dallas Area of the region is about 14 miles east of the city of Dallas and includes nearly half a dozen communities. In the heart of the region lies Lake Ray Hubbard, one of the larger lakes in Texas. Located on the east side of the lake is Rockwall – the fast-growing community claims a hometown feel with all of the advantages of a major city, and it draws people from all over to its summer evening concerts by the lake. Mesquite embraces its Texas flavor, but it’s not just home to the Pro Rodeo—it’s also the kind of place where kids can walk to school and families can focus on family, according to the mayor. Seen together, the area is a mix of city conveniences and room to breathe.
East Dallas Area Communities
By The Numbers
| 2017 | 2022 | |
|---|---|---|
| Population | 270,782 | 297,058 |
| Households | 89,854 | 98,045 |
| Average Household Size | 2.97 | 2.99 |
| Media Age | 33.7 | 33.9 |
| Median Household Income | $58,912 | $66,425 |
| Average Household Income | $77,492 | $84,123 |
| Per Capita Income | $26,060 | $28,088 |
Race and Ethnicity
| 2017 (%) | 2022 (%) | |
|---|---|---|
| White Alone | 175,170 (62.5%) | 191,823 (61.5%) |
| Black Alone | 49,762 (17.8%) | 55,135 (17.7%) |
| American Indian Alone | 2,282 (0.8%) | 2,546 (0.8%) |
| Asian Alone | 10,309 (3.7%) | 13,007 (4.2%) |
| Pacific Islander Alone | 209 (0.1%) | 252 (0.1%) |
| Some Other Race Alone | 33,053 (11.8%) | 38,166 (12.2%) |
| Two or More Races | 9,267 (3.3%) | 10,936 (3.5%) |
| Hispanic Origin (Any Race) | 87,171 (31.1%) | 101,658 (32.6%) |
Educational Attainment (Population 25+)
| 2017 | |
|---|---|
| TOTAL | 176,724 |
| Less Than 9th Grade | 7.2% |
| 9th-12th Grade, No Diploma | 9.5% |
| High School Graduate | 22.9% |
| GED/Alternative Credential | 4.3% |
| Some College, No Degree | 24.1% |
| Associate Degree | 7.6% |
| Bachelor’s Degree | 16.5% |
| Graduate/Professional Degree | 7.9% |
Household Expenditures (Average Annual Spend)
| 2017 | |
|---|---|
| TOTAL | $70,021 |
| Food | $8,555 |
| Housing | $21,513 |
| Apparel and Services | $2,241 |
| Transportation | $8,325 |
| Travel | $20,060 |
| Healthcare | $5,456 |
| Entertainment and Recreation | $3,124 |
| Personal Care Products/Services | $808 |
| Education | $1,402 |


