Fort Worth Area
#cmsmasters_row_661e8108e8ee80_45573056 .cmsmasters_row_outer_parent { padding-top: 0px; } #cmsmasters_row_661e8108e8ee80_45573056 .cmsmasters_row_outer_parent { padding-bottom: 50px; }
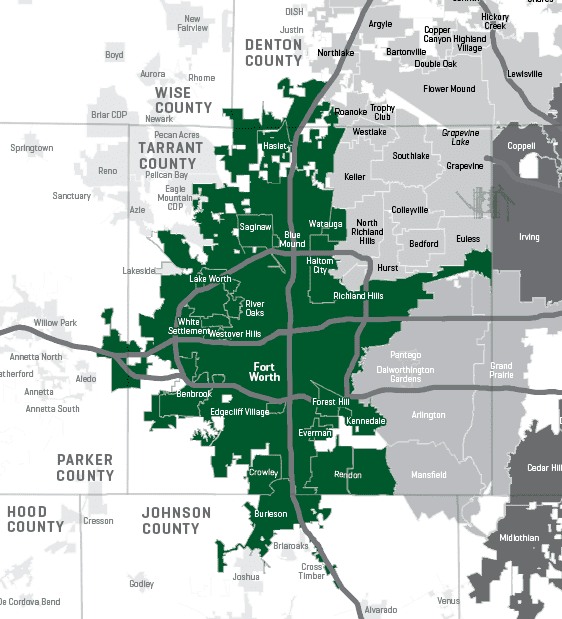
The city of Fort Worth began in 1849 as an army outpost protecting settlers from Indians. It grew rapidly after the Civil War due to its location on the Chisholm Trail, on which cattle were driven to Kansas to be transported via train—earning it the nickname “Cowtown.” The name stuck, and the now cosmopolitan city still uses a longhorn steer as part of its official logo and maintains the Fort Worth Stockyards as a historic district and tourist destination. But people who call the area home know this city’s present encompasses more than its past.
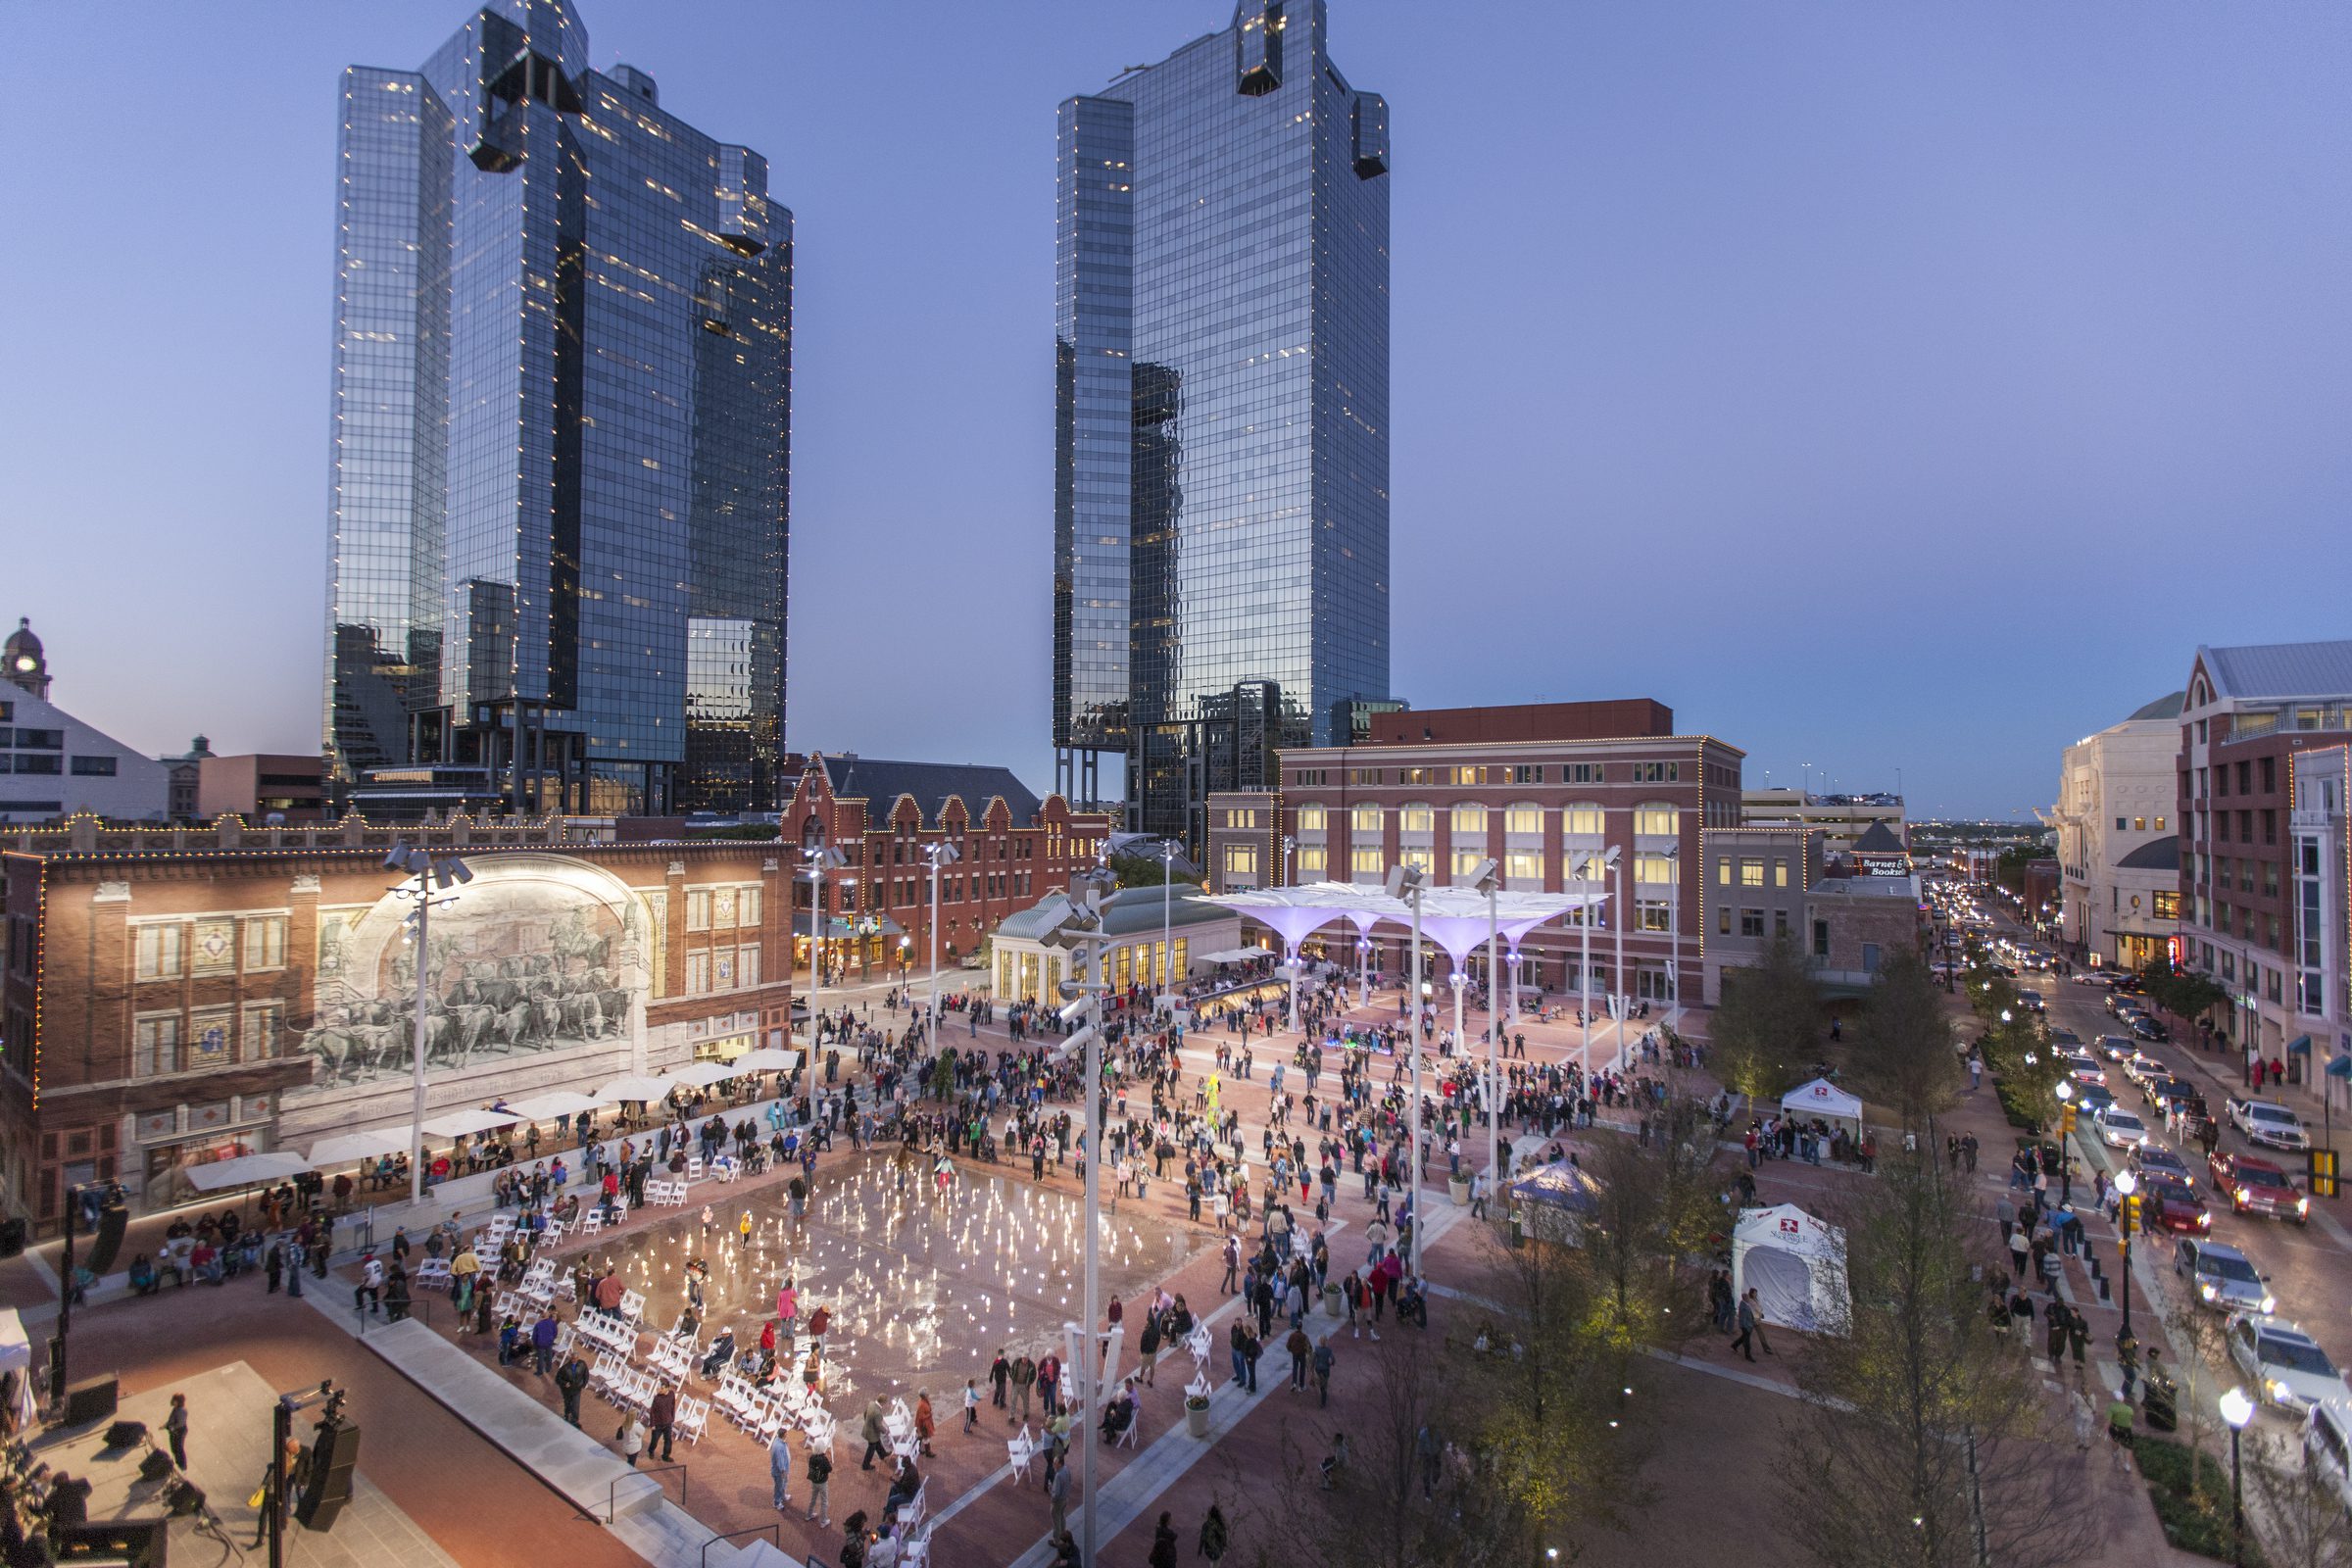
In the last decade, it has been one of the fastest-growing areas in the country, and Fort Worth is continually recognized by Money, Fortune, and other magazines as one of the best places to live and work in the United States. A healthy job market, affordable housing, and the energy associated with several colleges and universities contribute to its vibrancy. And then you have the cultural offerings: Fort Worth has exceptional museums (including Kimbell Art Museum, Amon Carter Museum of American Art, and The Modern) and galleries, as well as the gorgeous Bass Performance Hall in Sundance Square. The general vibe of Fort Worth is different from that of Dallas, and though the cities are usually tied together by outsiders, they are distinct in many ways.
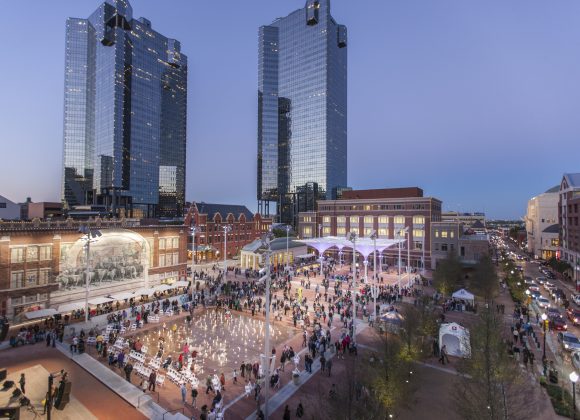
Fort Worth Sundance Square 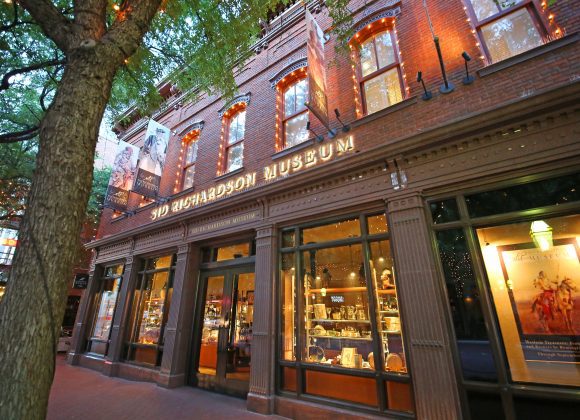
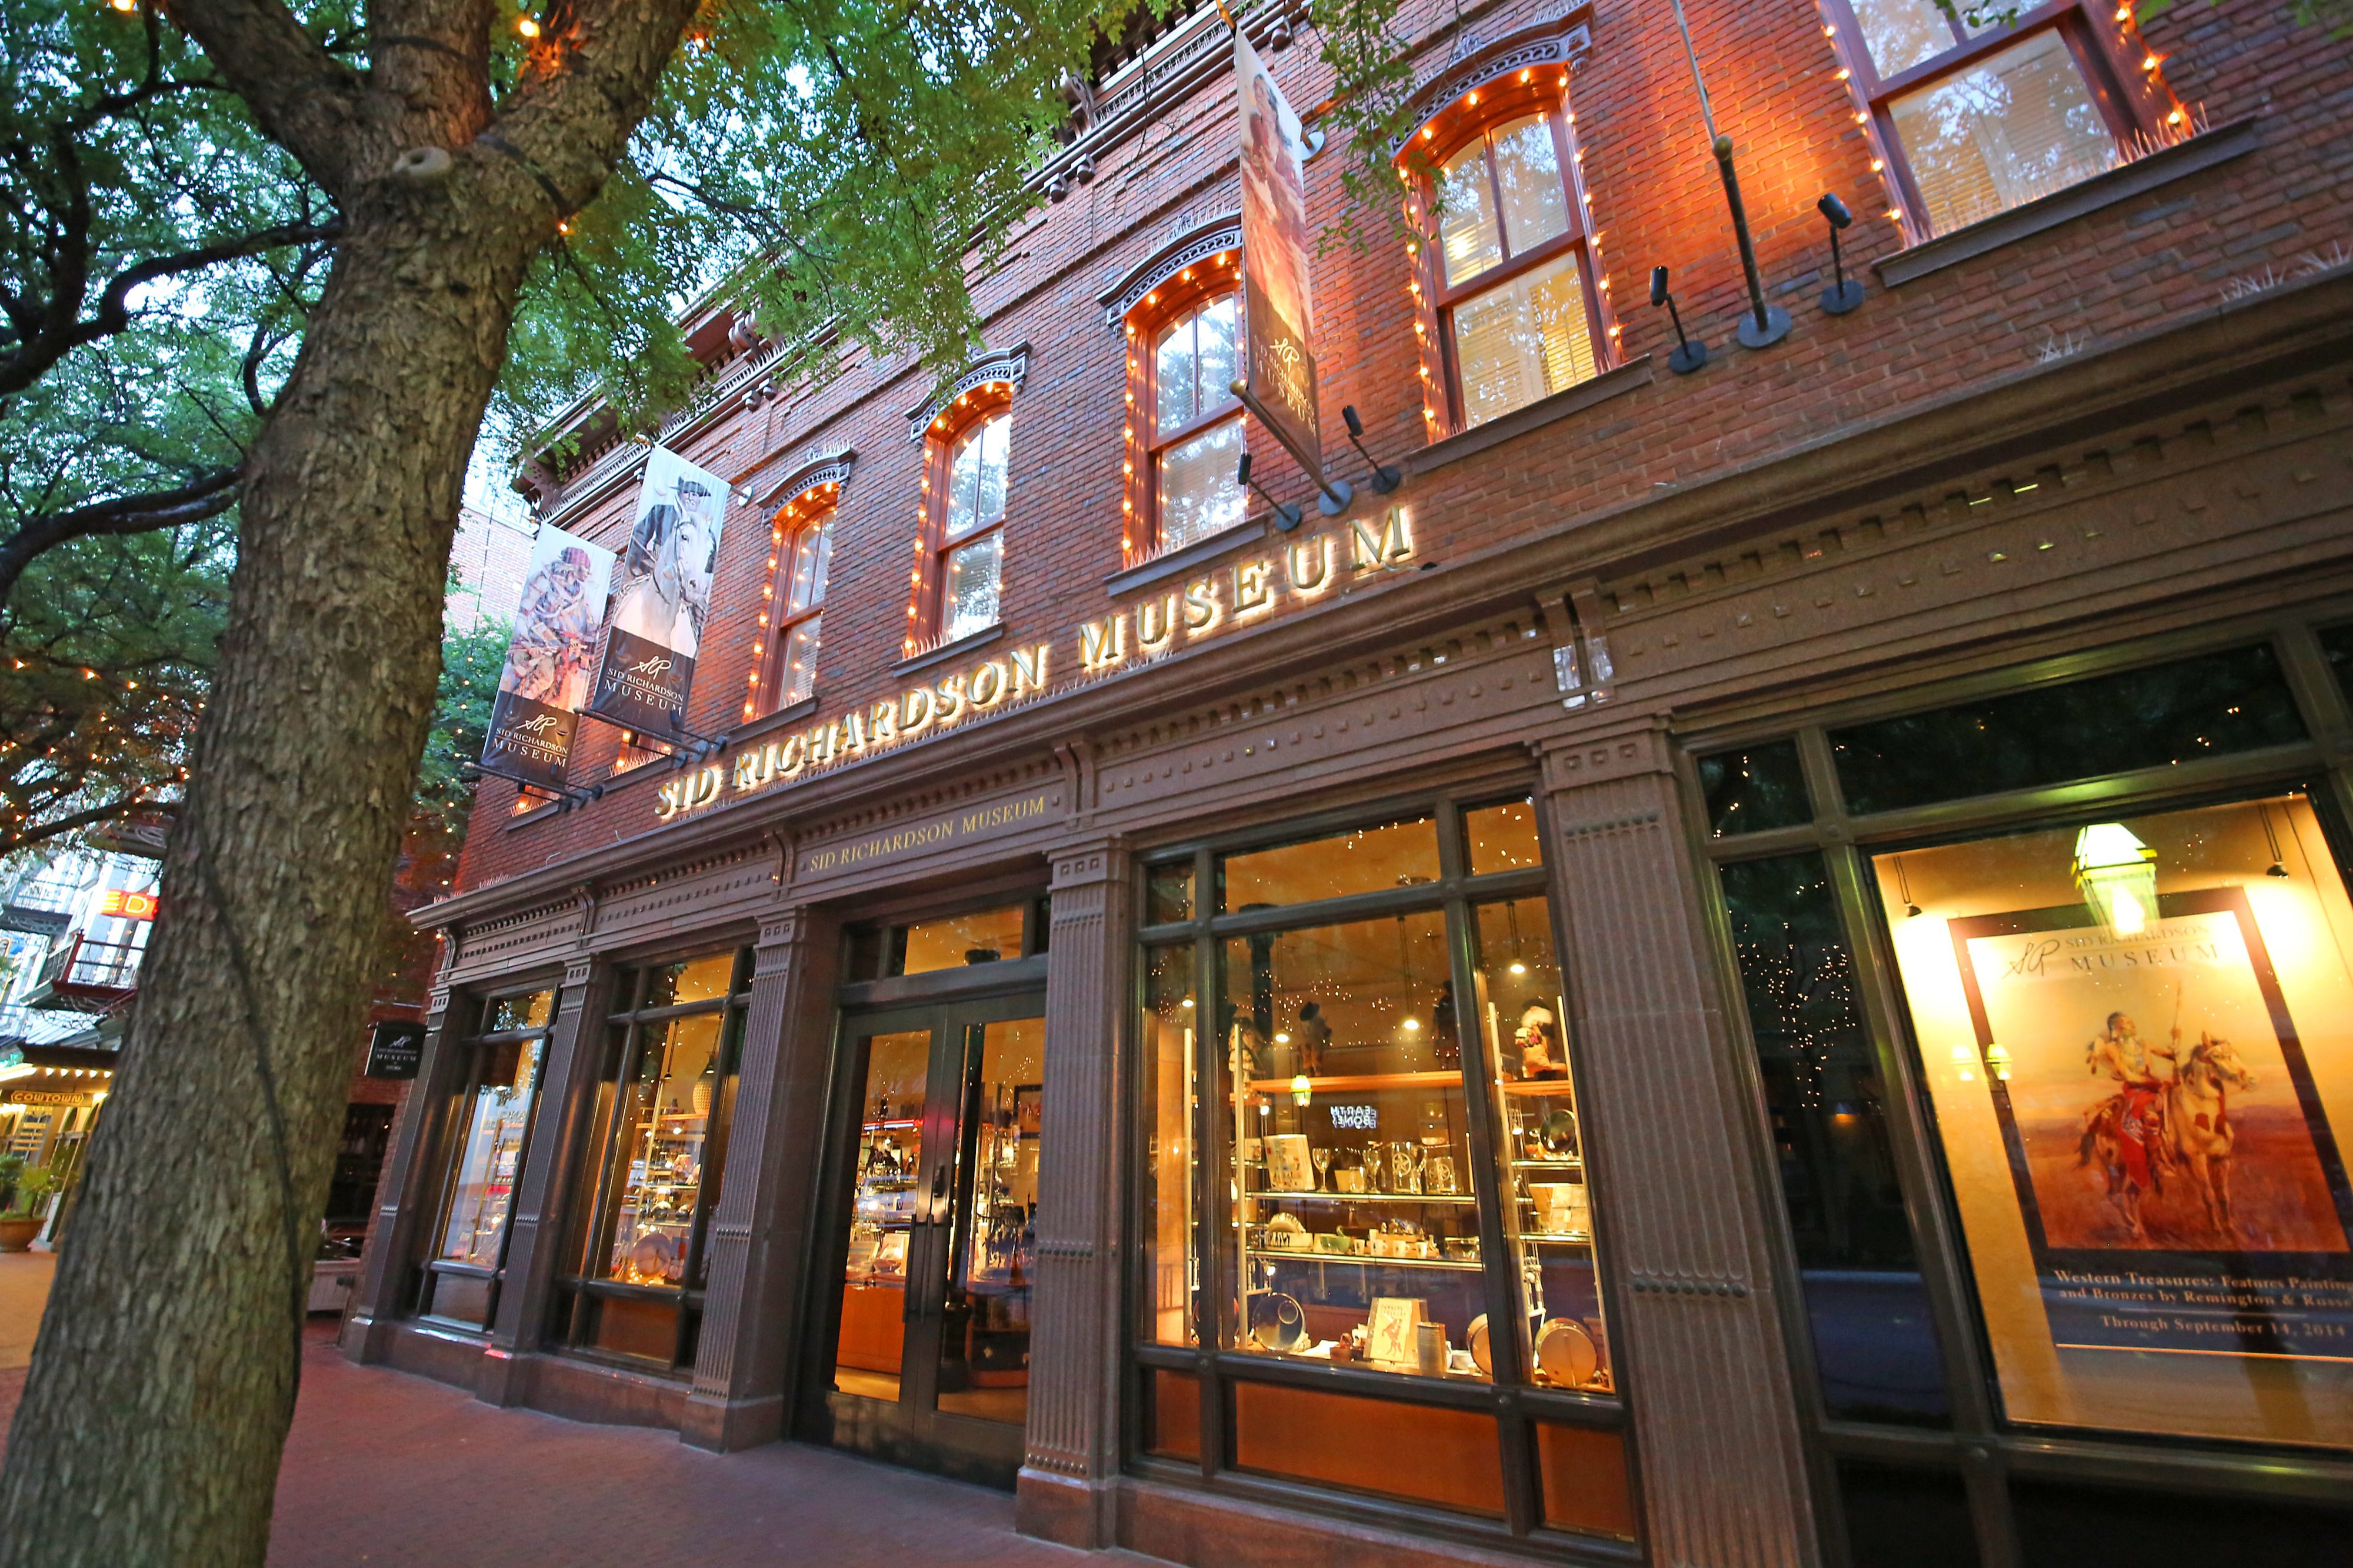
Sid Richardson Museum - Fort Worth 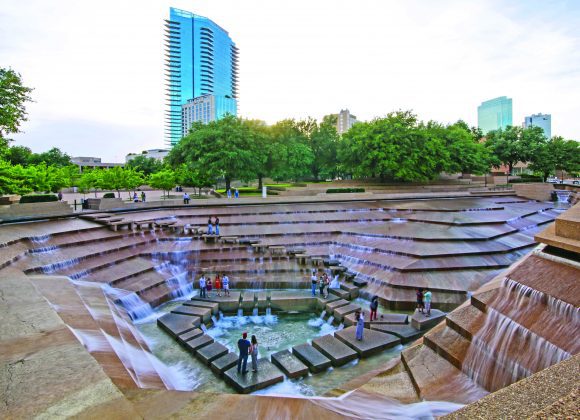
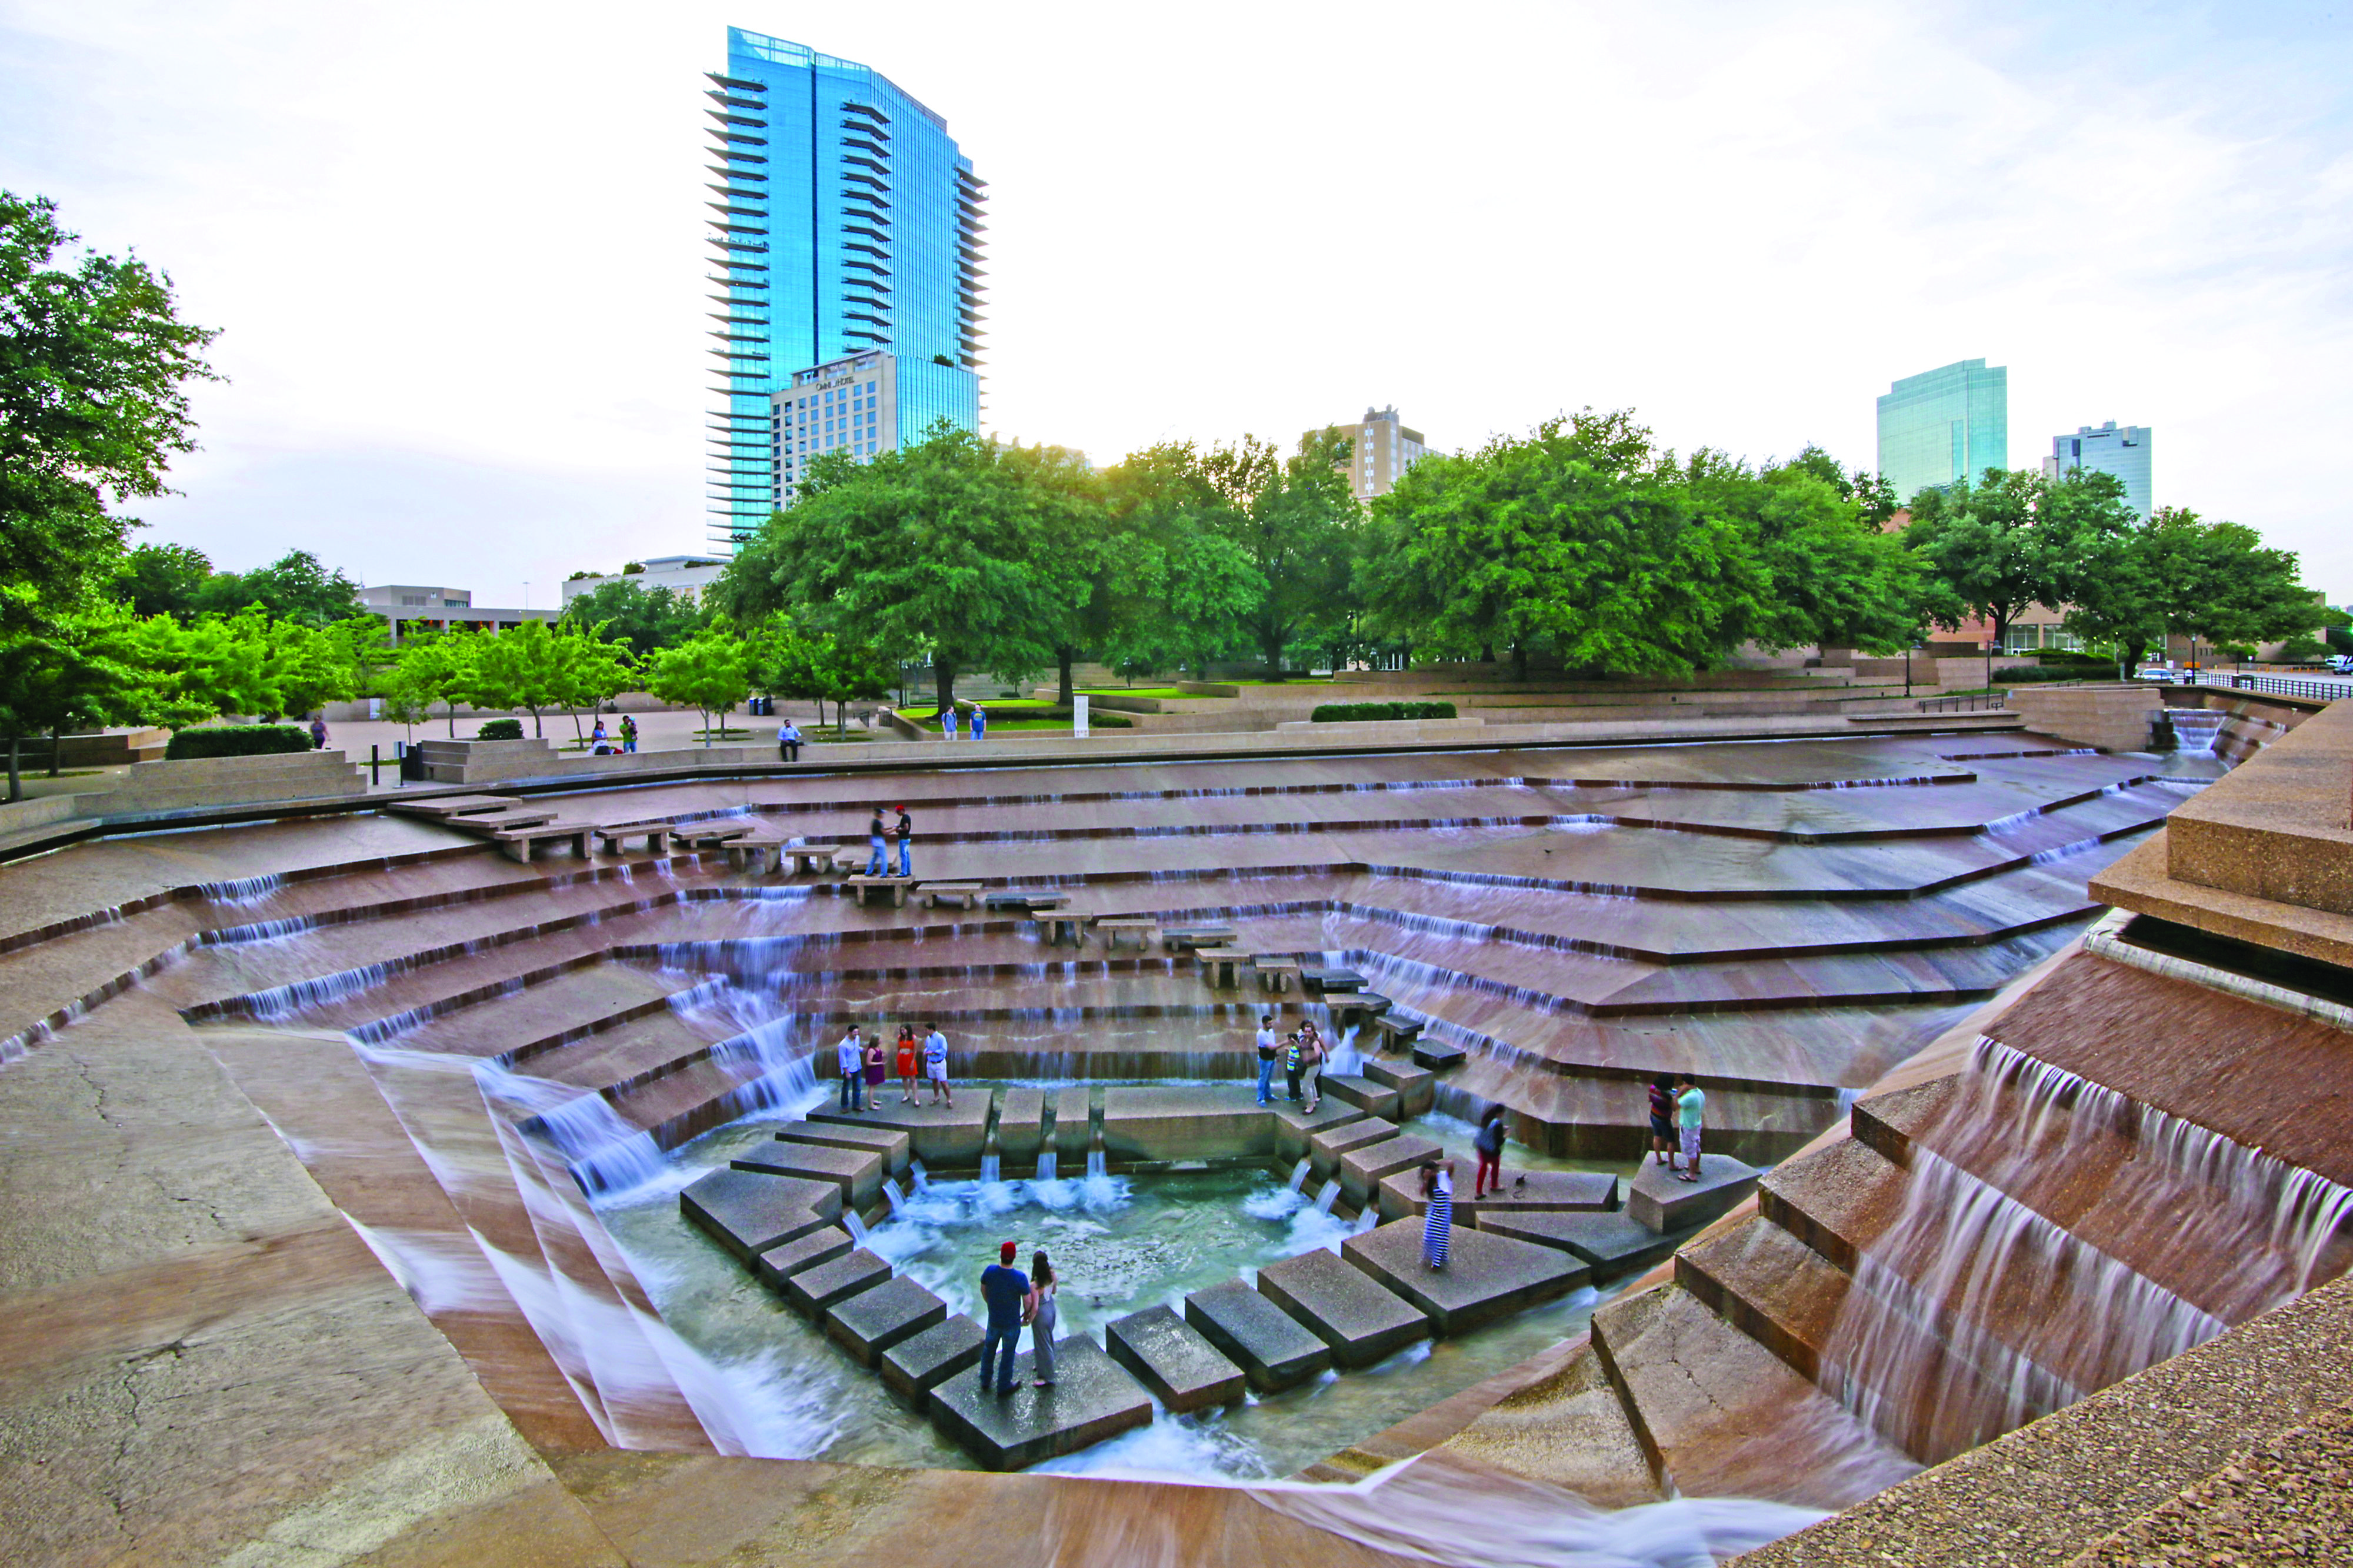
Fort Worth Water Gardens 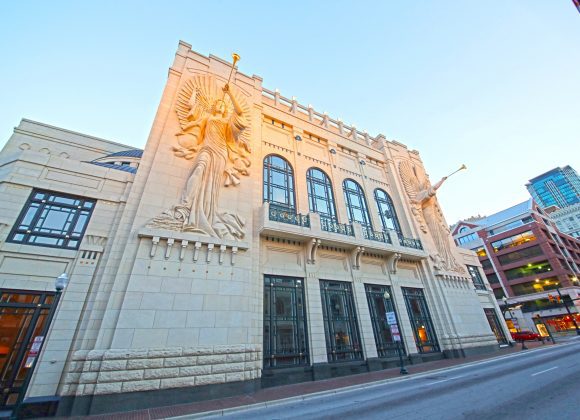
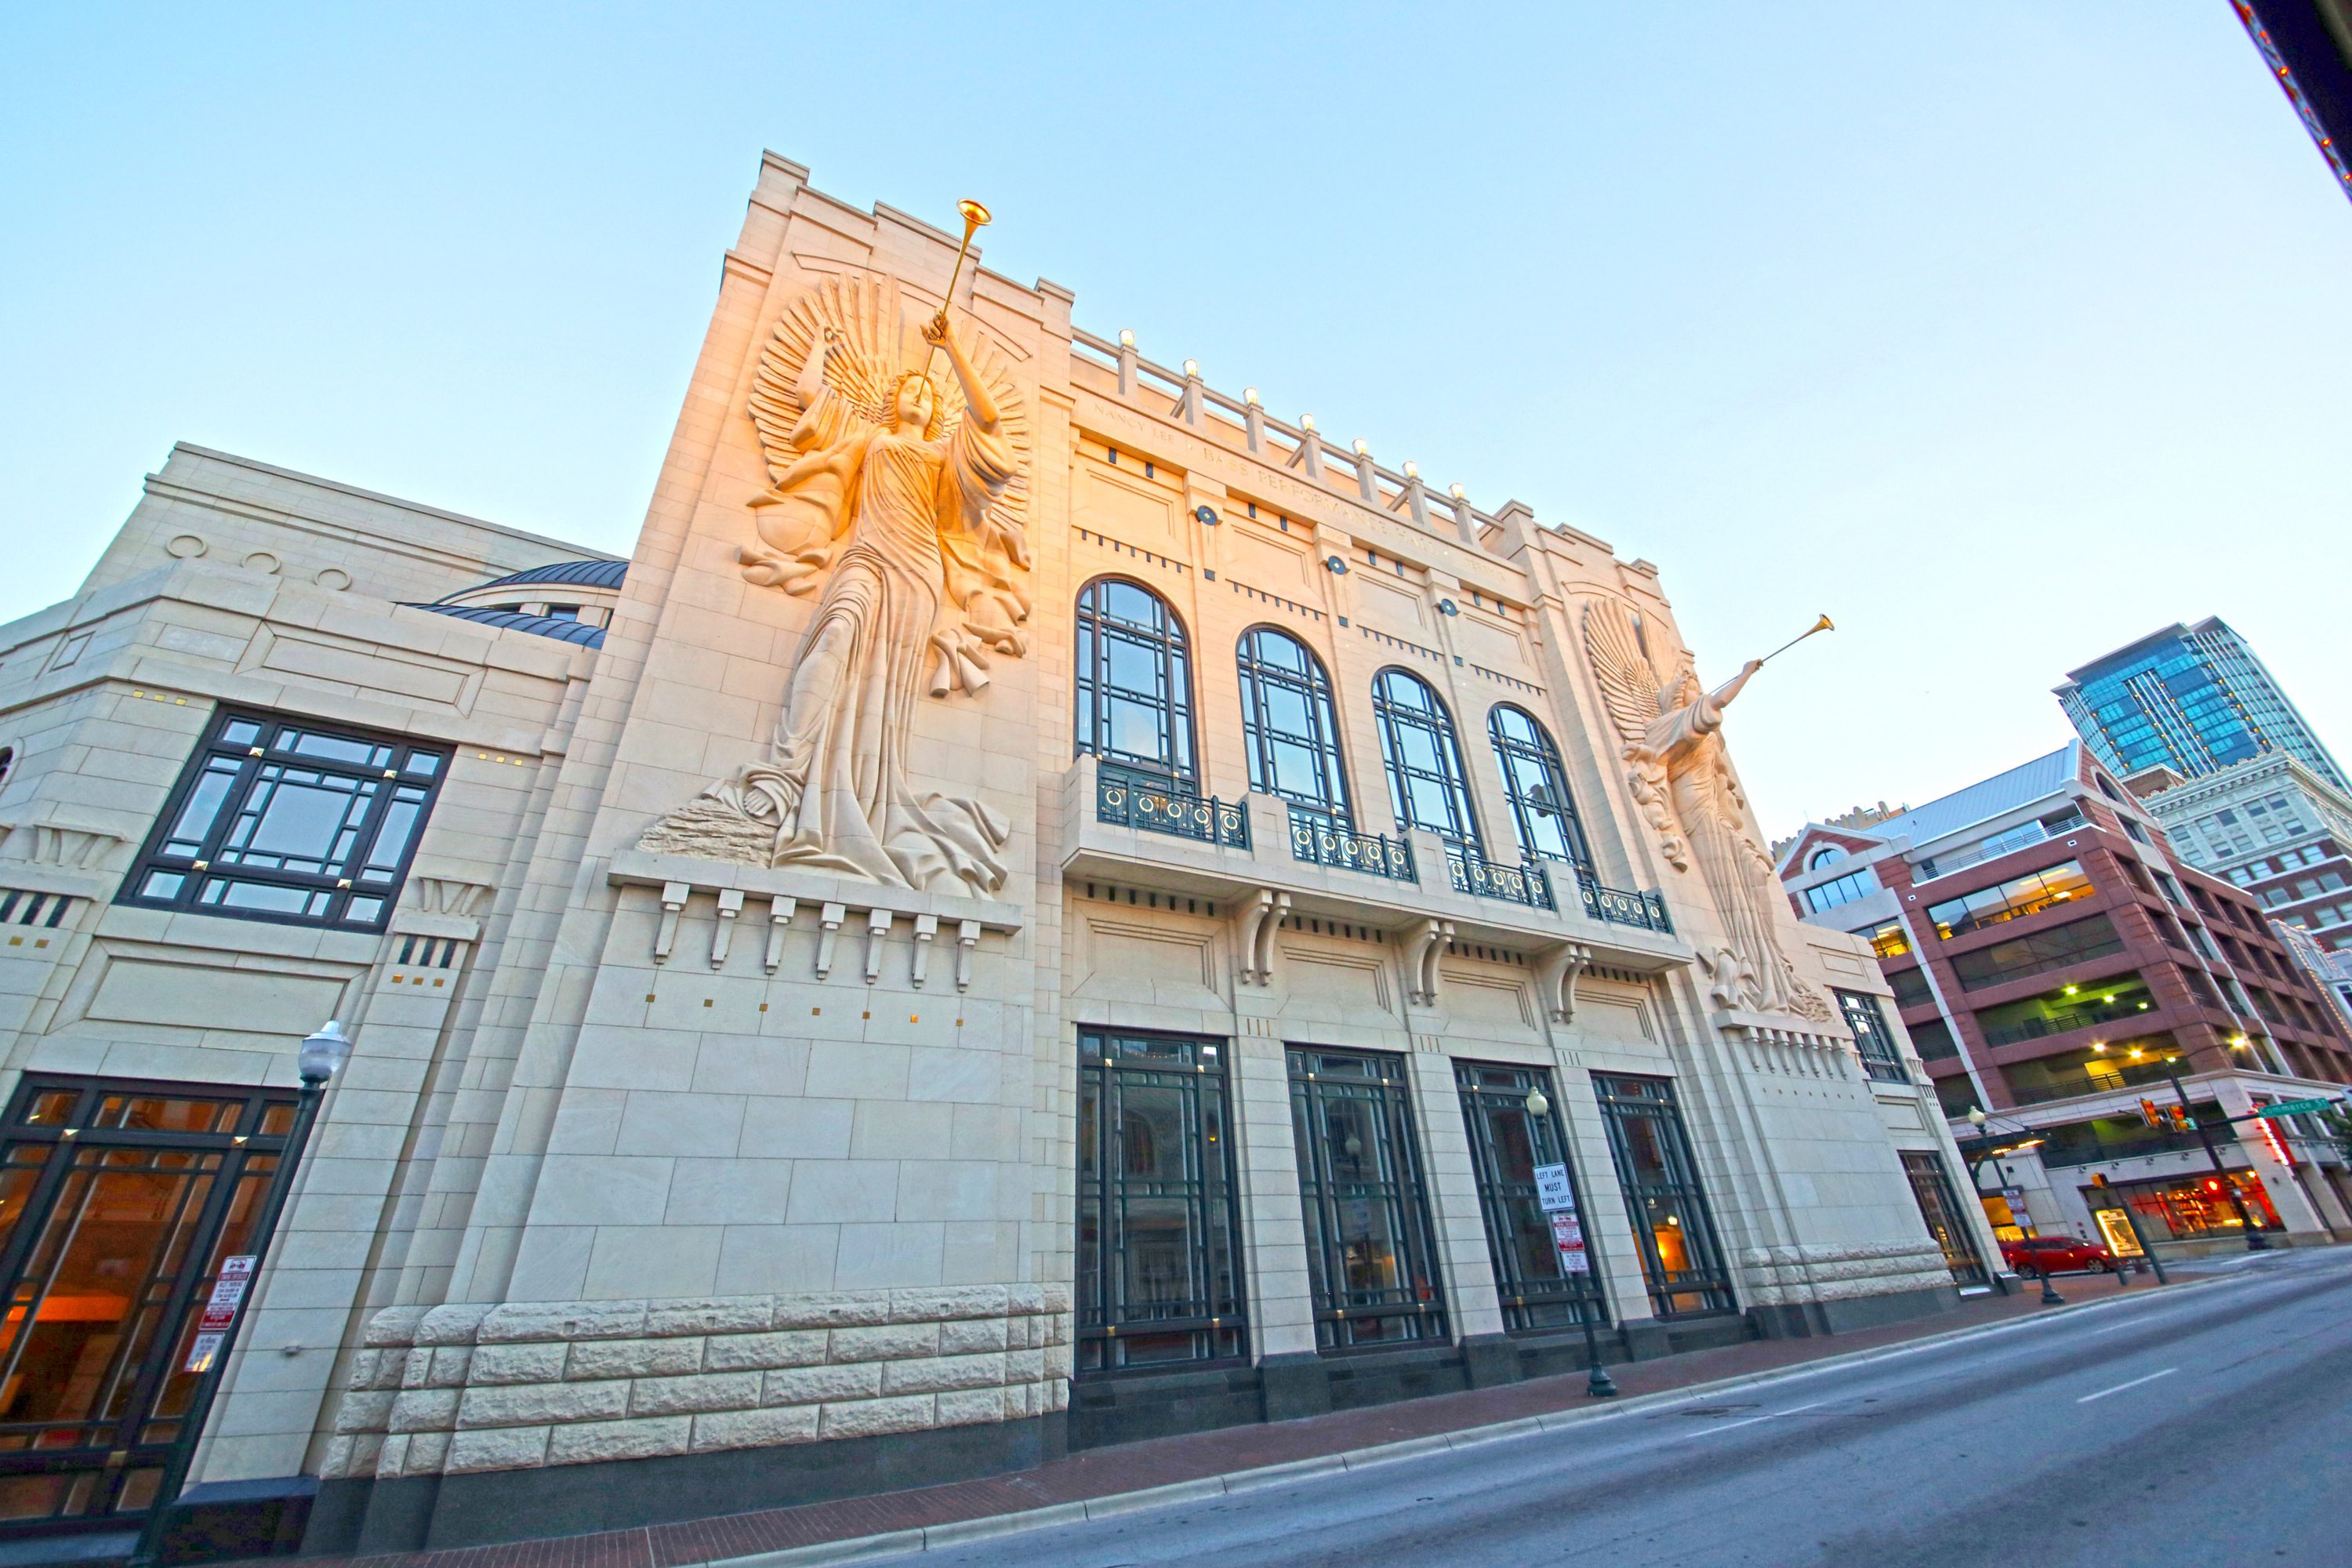
Bass Performance Hall
By The Numbers
| 2017 | 2022 | |
|---|---|---|
| Population | 1,113,004 | 1,211,376 |
| Households | 391,385 | 424,745 |
| Average Household Size | 2.80 | 2.81 |
| Media Age | 33.2 | 33.4 |
| Median Household Income | $55,886 | $61,692 |
| Average Household Income | $75,014 | $85,198 |
| Per Capita Income | $26,805 | $30,268 |
Race and Ethnicity
| 2017 (%) | 2022 (%) | |
|---|---|---|
| White Alone | 689,111 (61.9%) | 711,868 (59.9%) |
| Black Alone | 191,950 (17.2%) | 218,188 (18%) |
| American Indian Alone | 7,142 (0.6%) | 7,659(0.6%) |
| Asian Alone | 46,811 (4.2%) | 56,754 (4.7%) |
| Pacific Islander Alone | 1,392 (0.1%) | 1,680 (0.1%) |
| Some Other Race Alone | 138,706 (12.5%) | 156,445 (12.9%) |
| Two or More Races | 37,895 (3.4%) | 44,634 (3.7%) |
| Hispanic Origin (Any Race) | 362,957 (33.5%) | 417,336 (35.3%) |
Educational Attainment (Population 25+)
| 2017 | |
|---|---|
| TOTAL | 698,405 |
| Less Than 9th Grade | 8.6% |
| 9th-12th Grade, No Diploma | 9% |
| High School Graduate | 21.9% |
| GED/Alternative Credential | 4.5% |
| Some College, No Degree | 22.7% |
| Associate Degree | 6.8% |
| Bachelor’s Degree | 18% |
| Graduate/Professional Degree | 8.6% |
Household Expenditures (Average Annual Spend)
| 2017 | |
|---|---|
| TOTAL | $65,020 |
| Food | $7,998 |
| Housing | $20,055 |
| Apparel and Services | $2,073 |
| Transportation | $7,770 |
| Travel | $1,870 |
| Healthcare | $5,076 |
| Entertainment and Recreation | $2,898 |
| Personal Care Products/Services | $747 |
| Education | $1,299 |