Northeast Dallas County
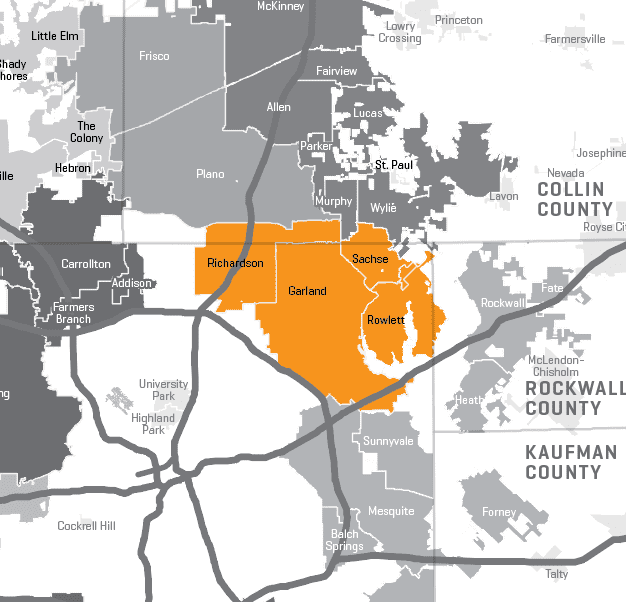
Northeast Dallas County
Two big communities – Richardson and Garland – make up Northeast Dallas County, which includes the Telecom Corridor, named for its concentration of high-tech firms such as Texas Instruments, Ericsson, and Samsung Mobile. Richardson is a fast commute to downtown Dallas or the Plano/Frisco area, with lots of affordable single-family homes, good schools, and a diverse population. The City of Garland is an older city with many affordable single-family homes and apartments. Lake Hubbard and easy access via the President George Bush Turnpike and Interstate 30 are some of the top reasons people choose the upscale suburb of Rowlett.
Northeast Dallas County Communities
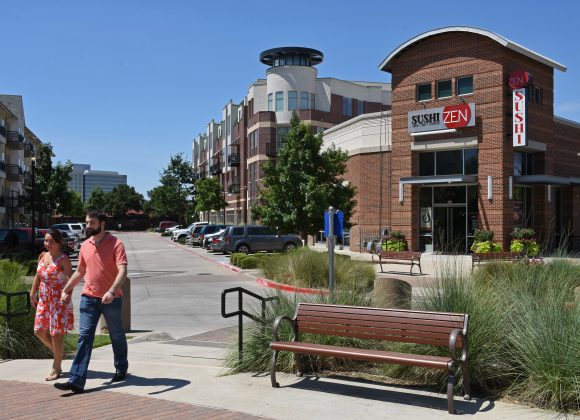
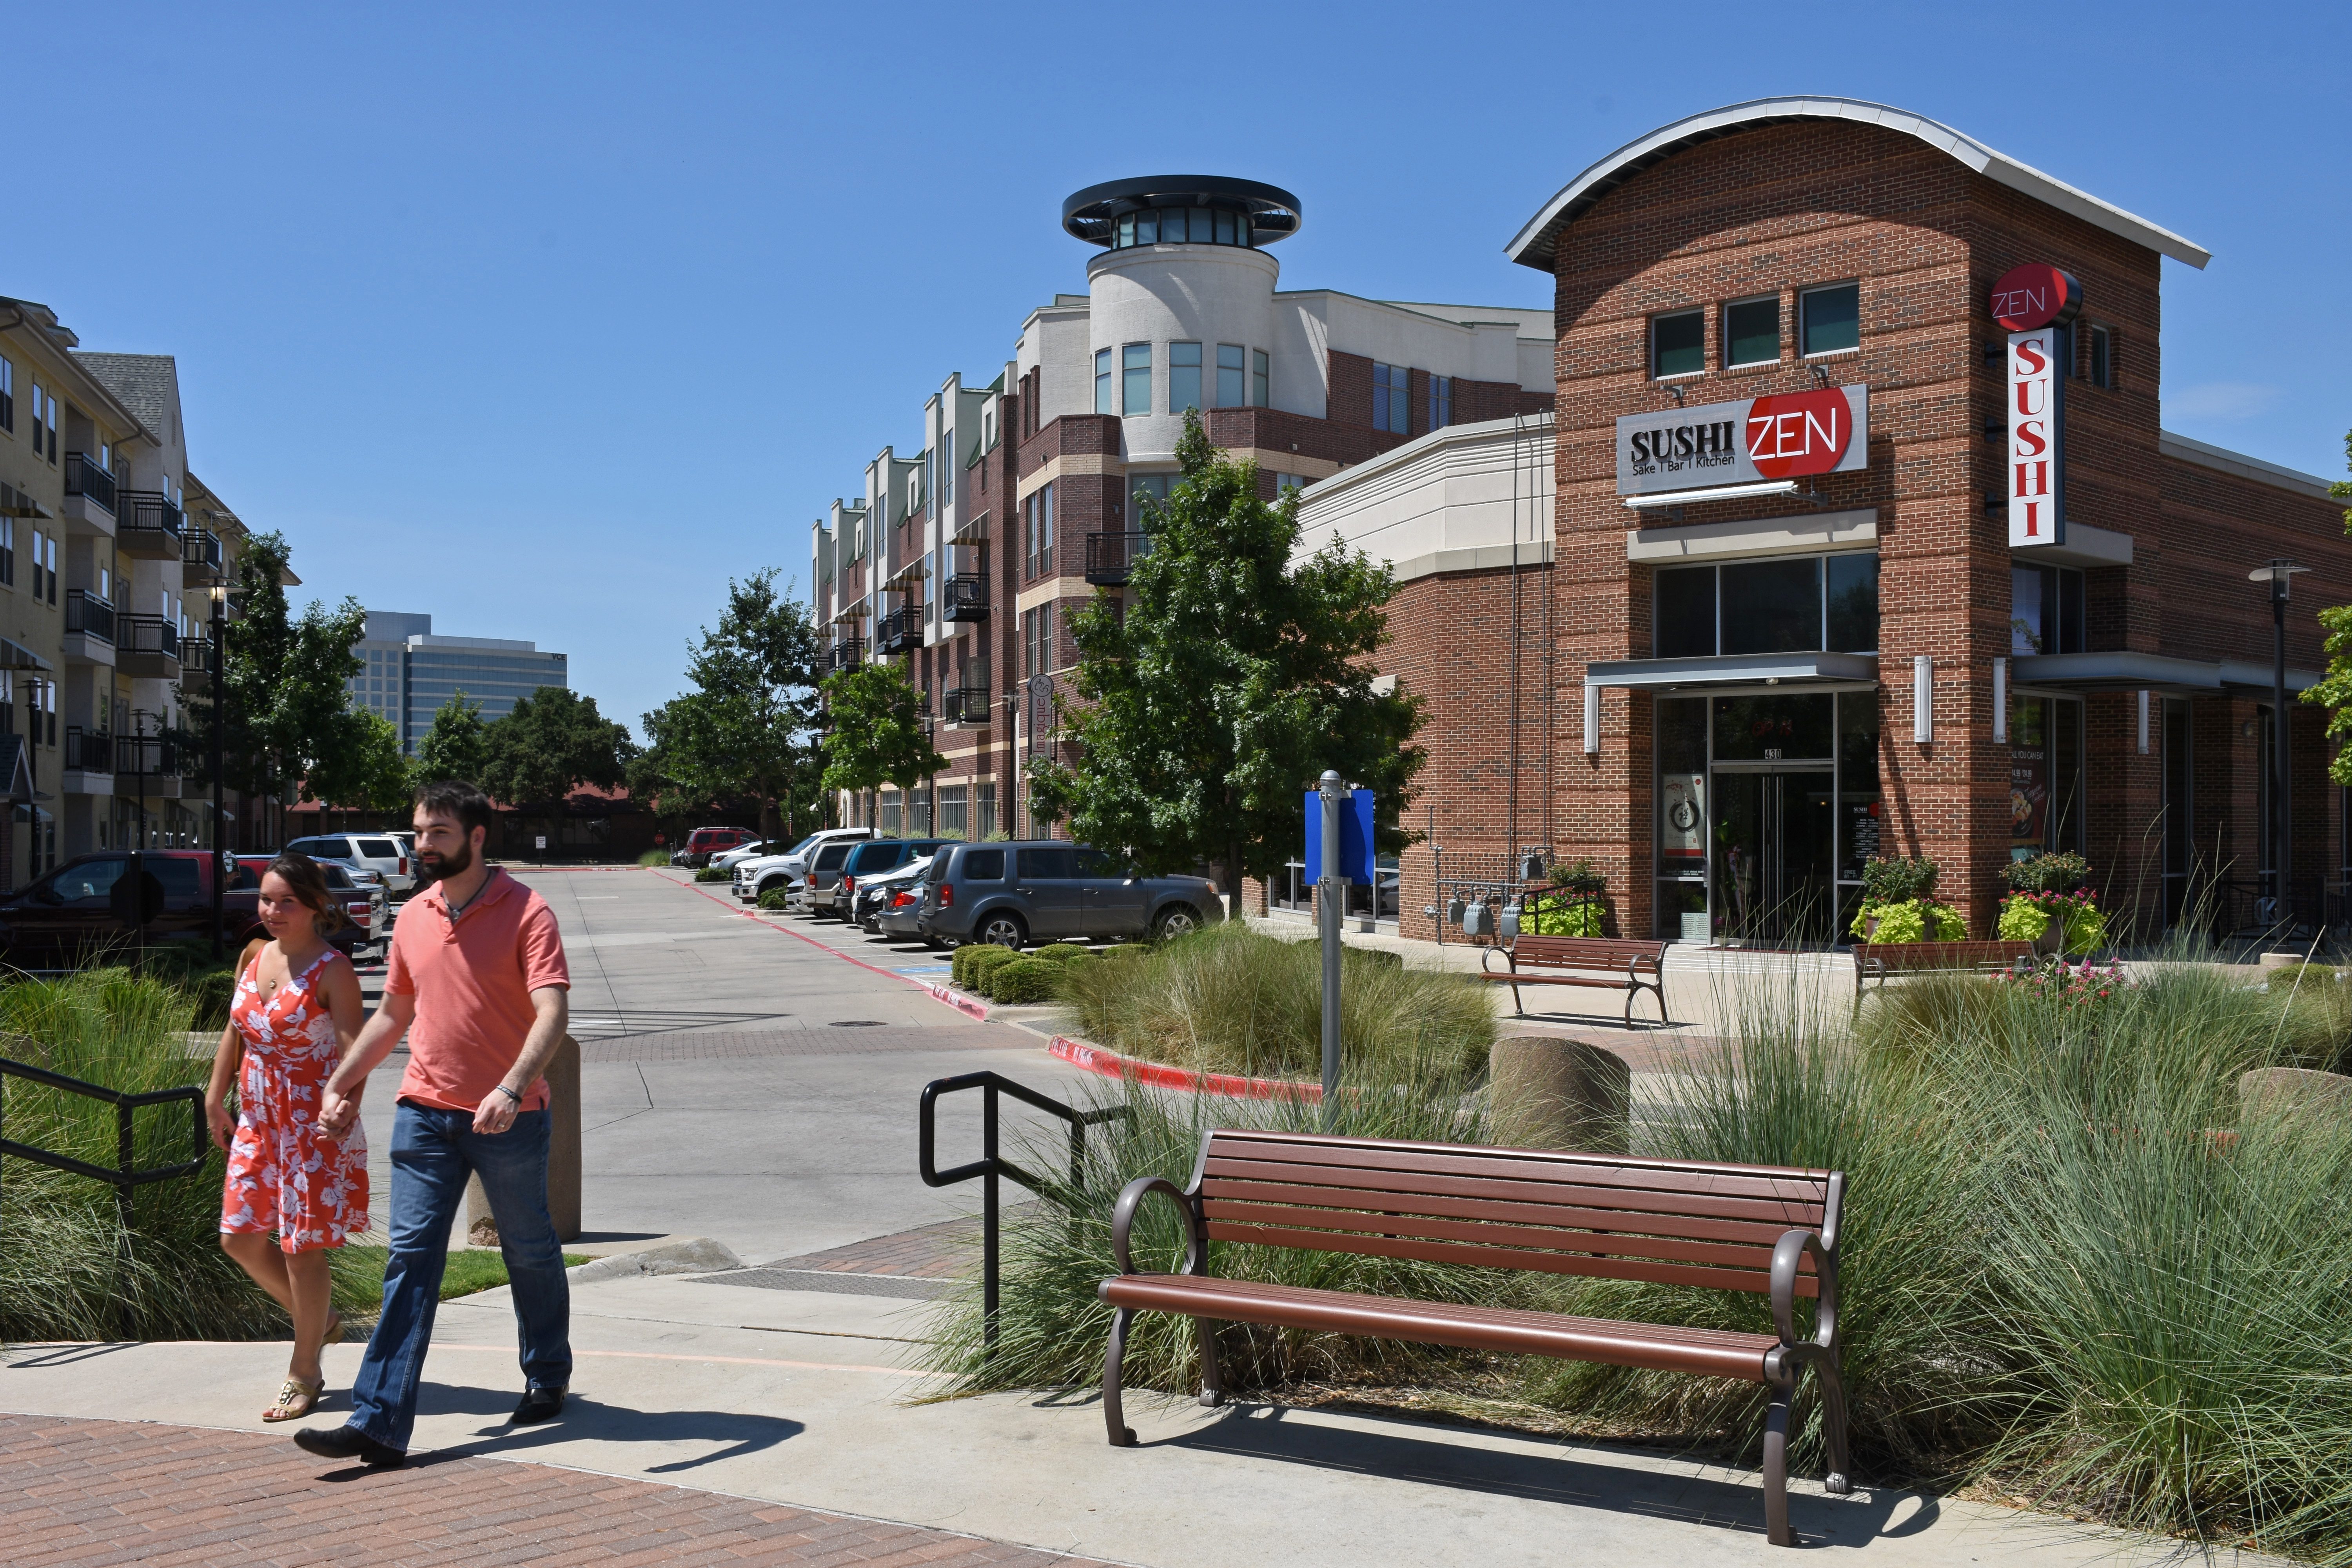
Eastside Development, City of Richardson 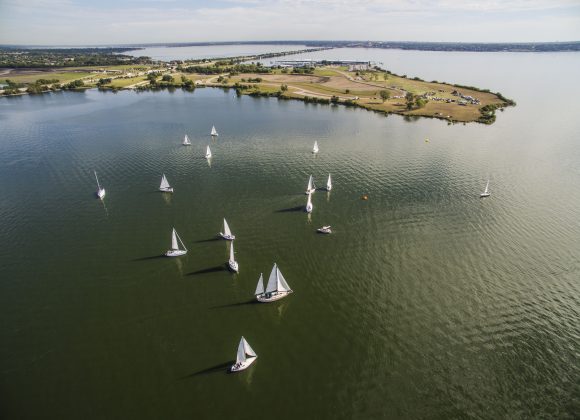
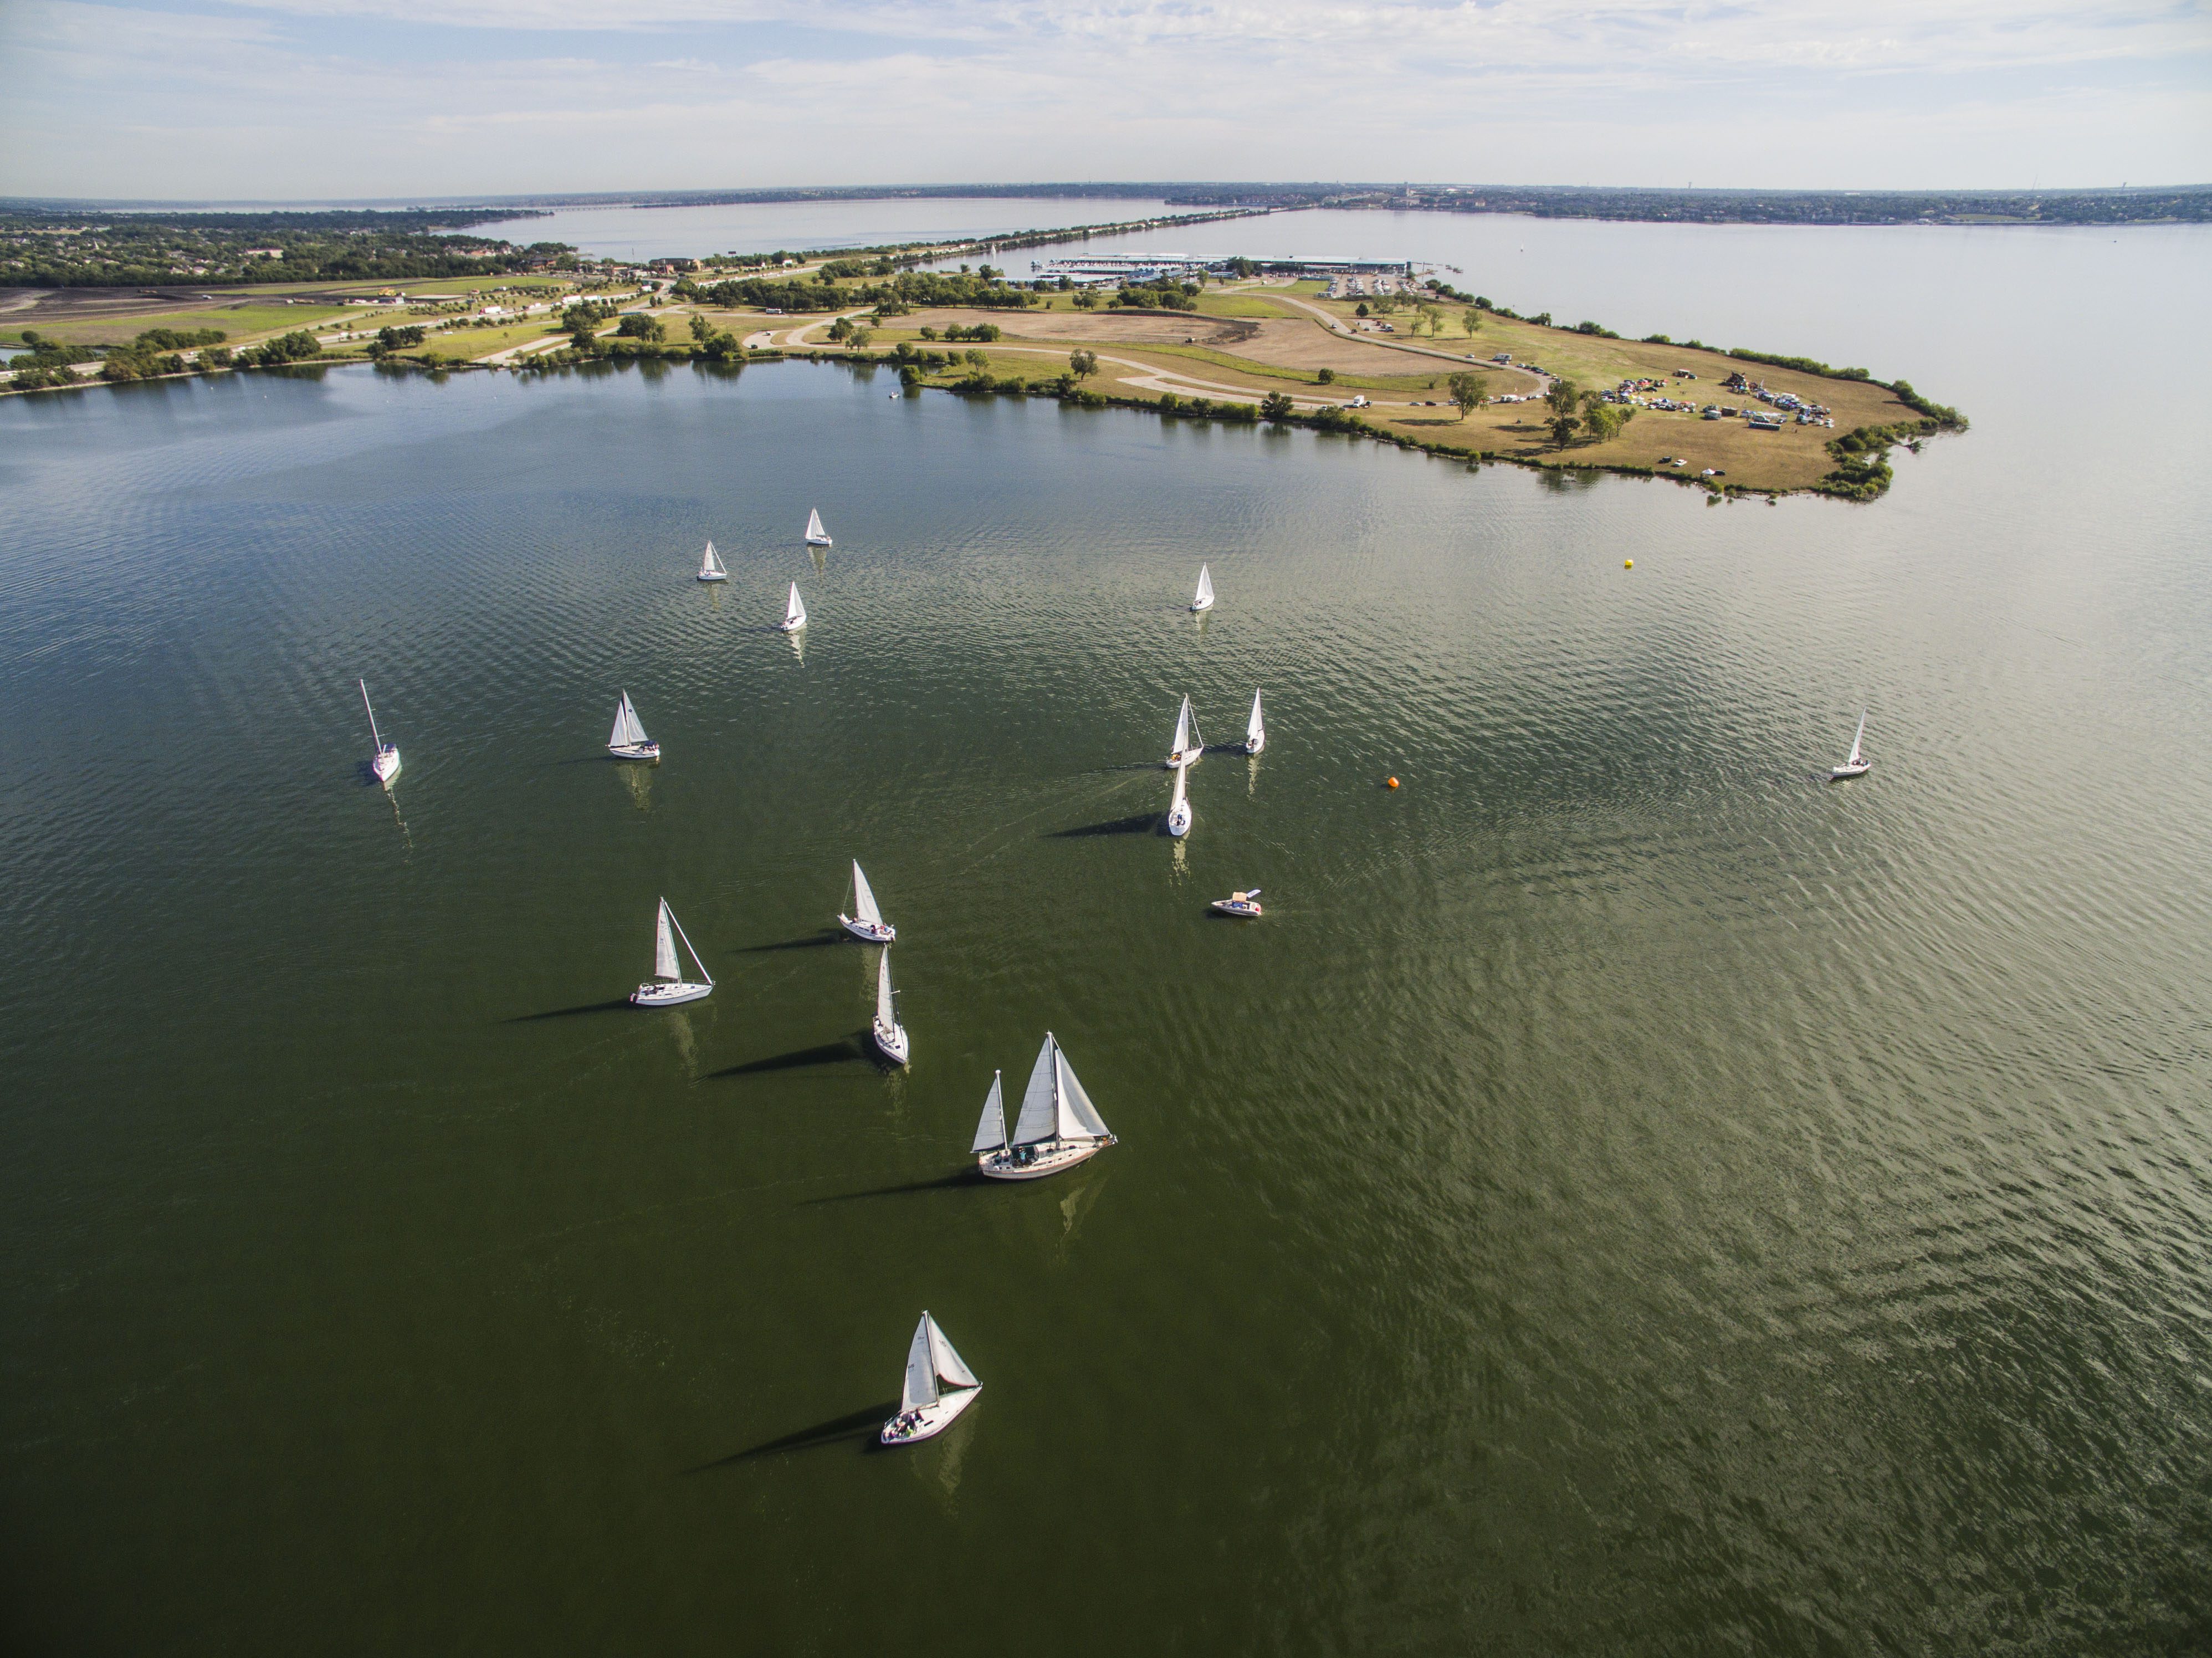
Lake Ray Hubbard 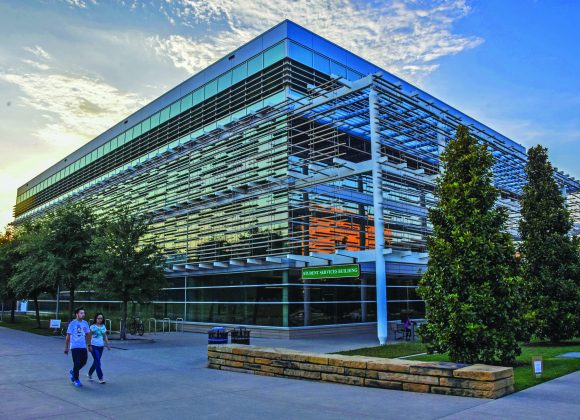
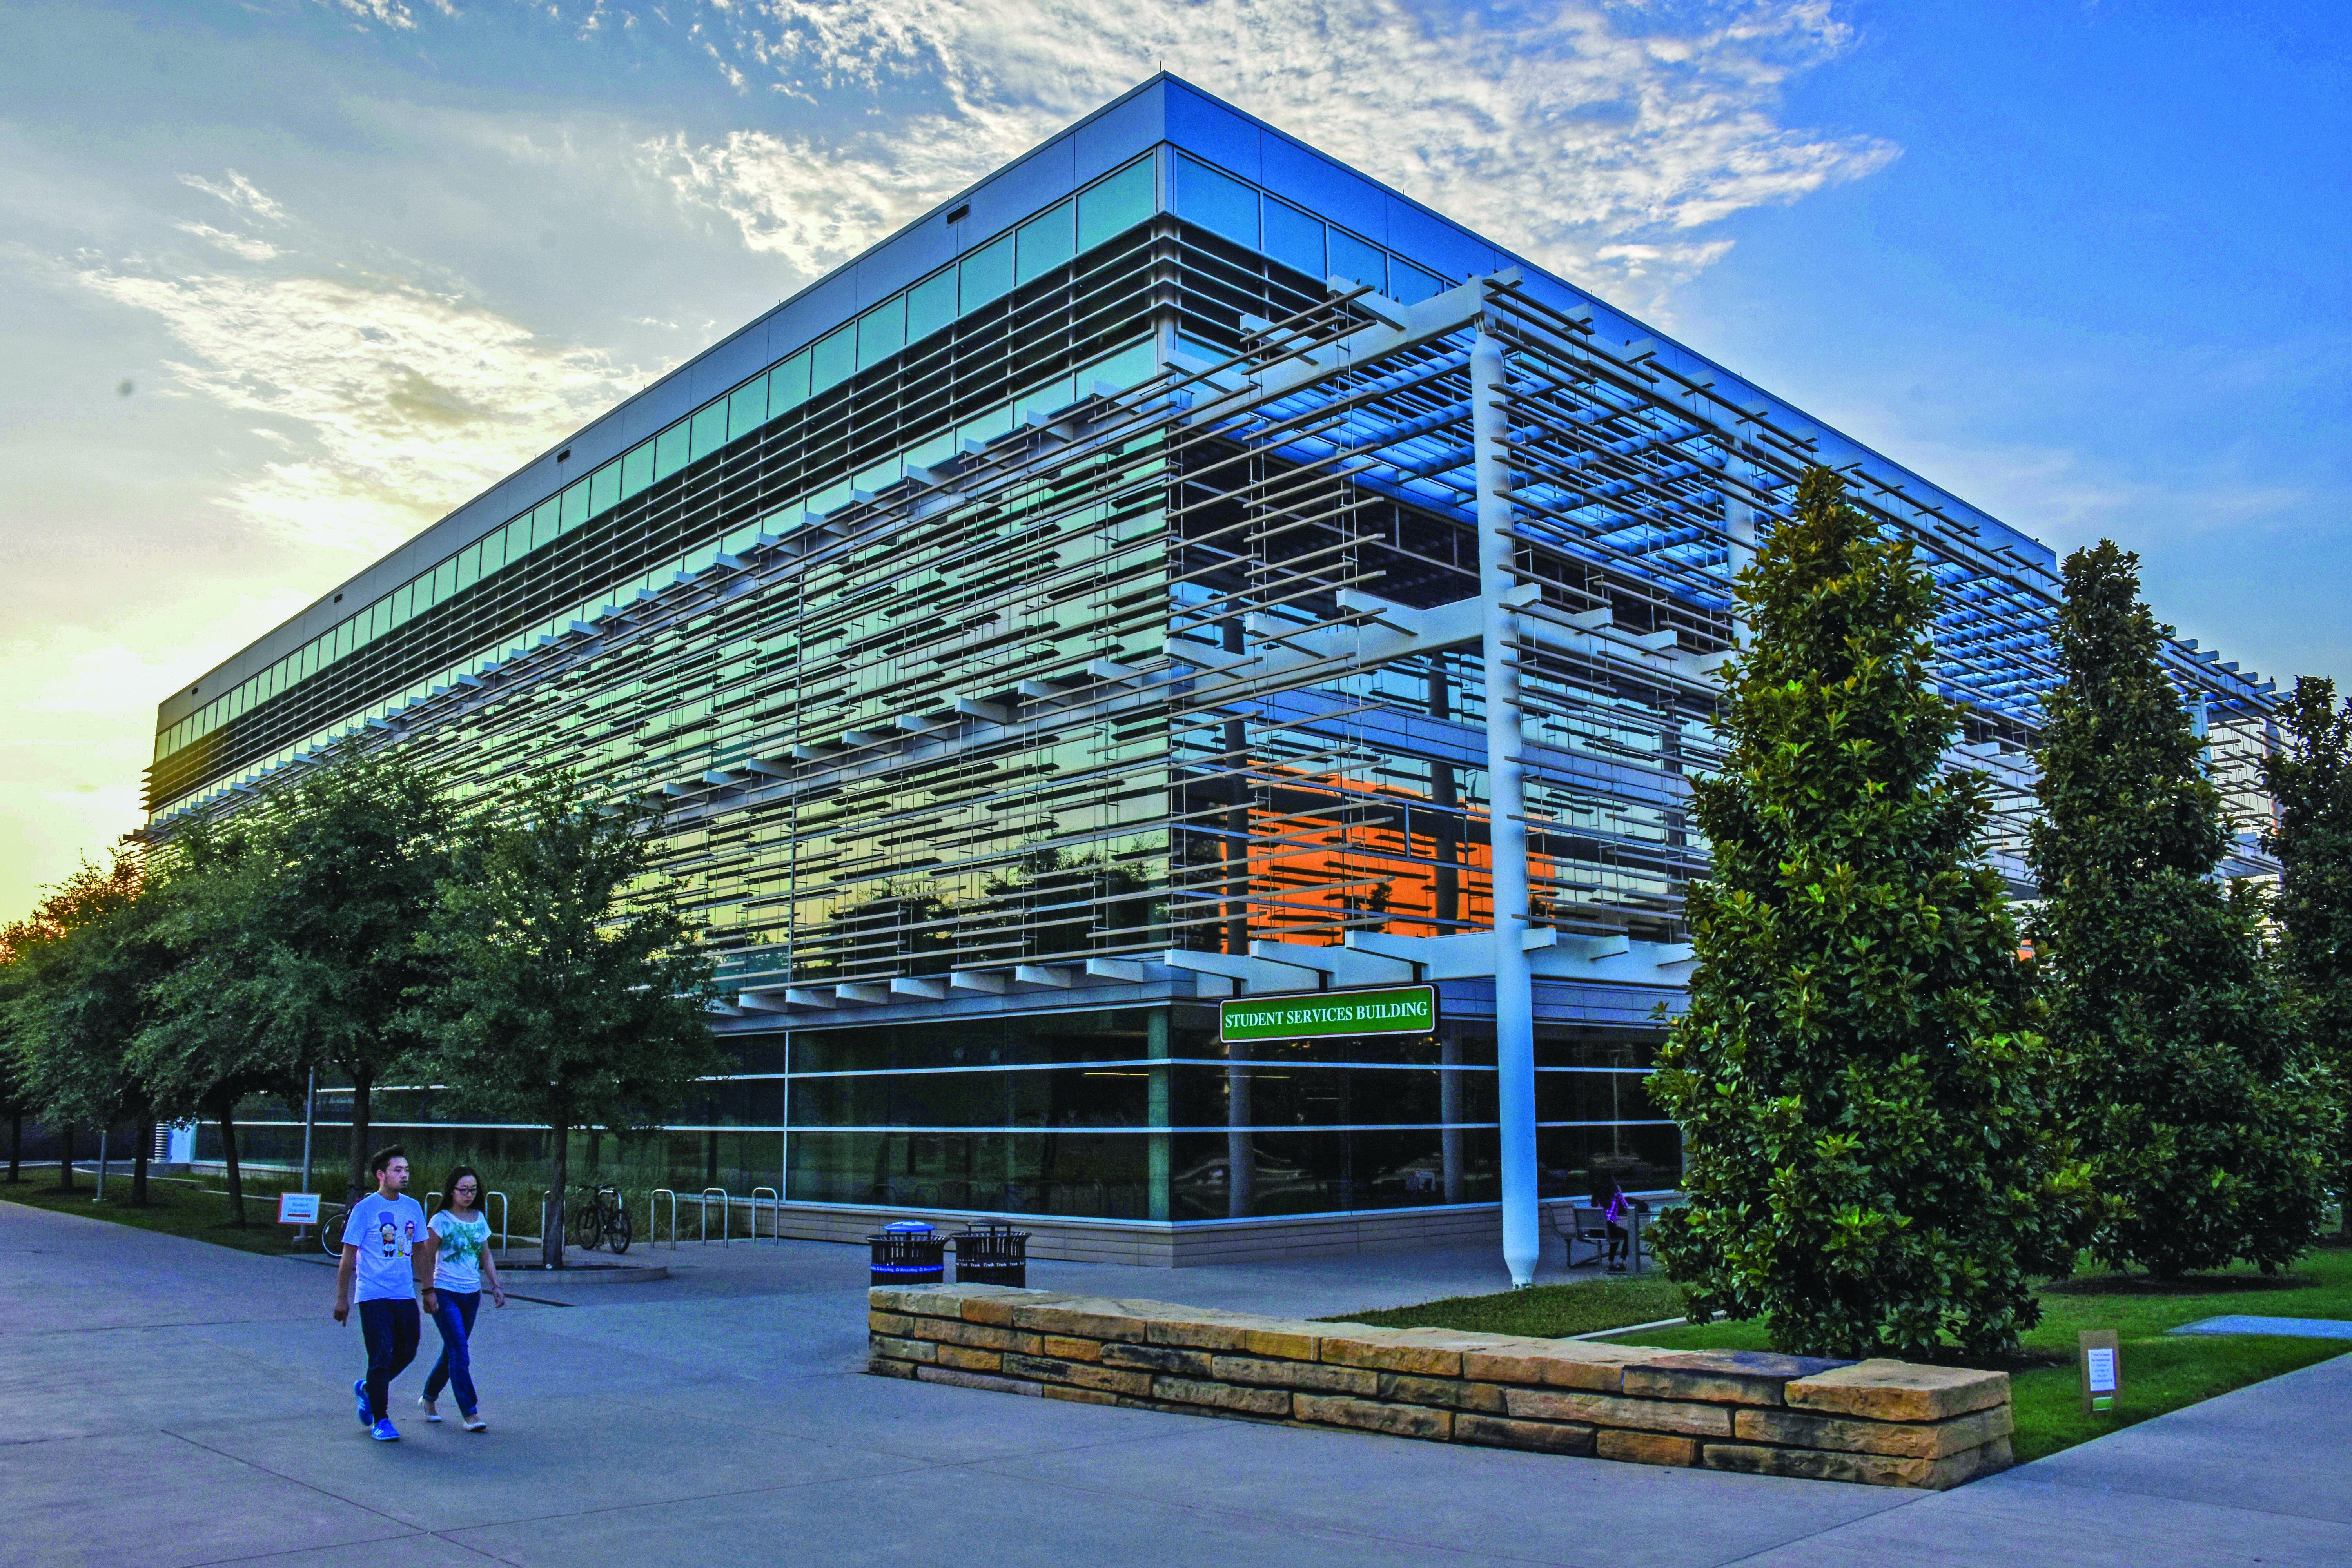
University of Texas at Dallas 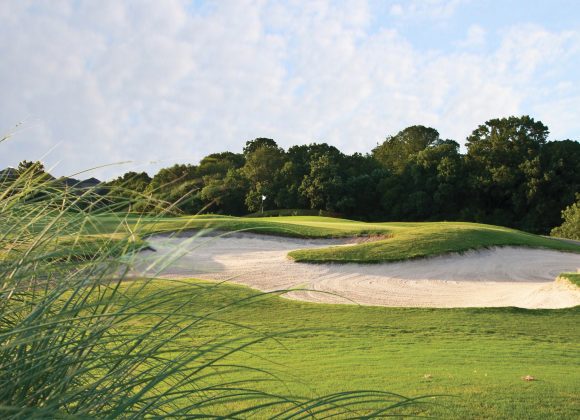
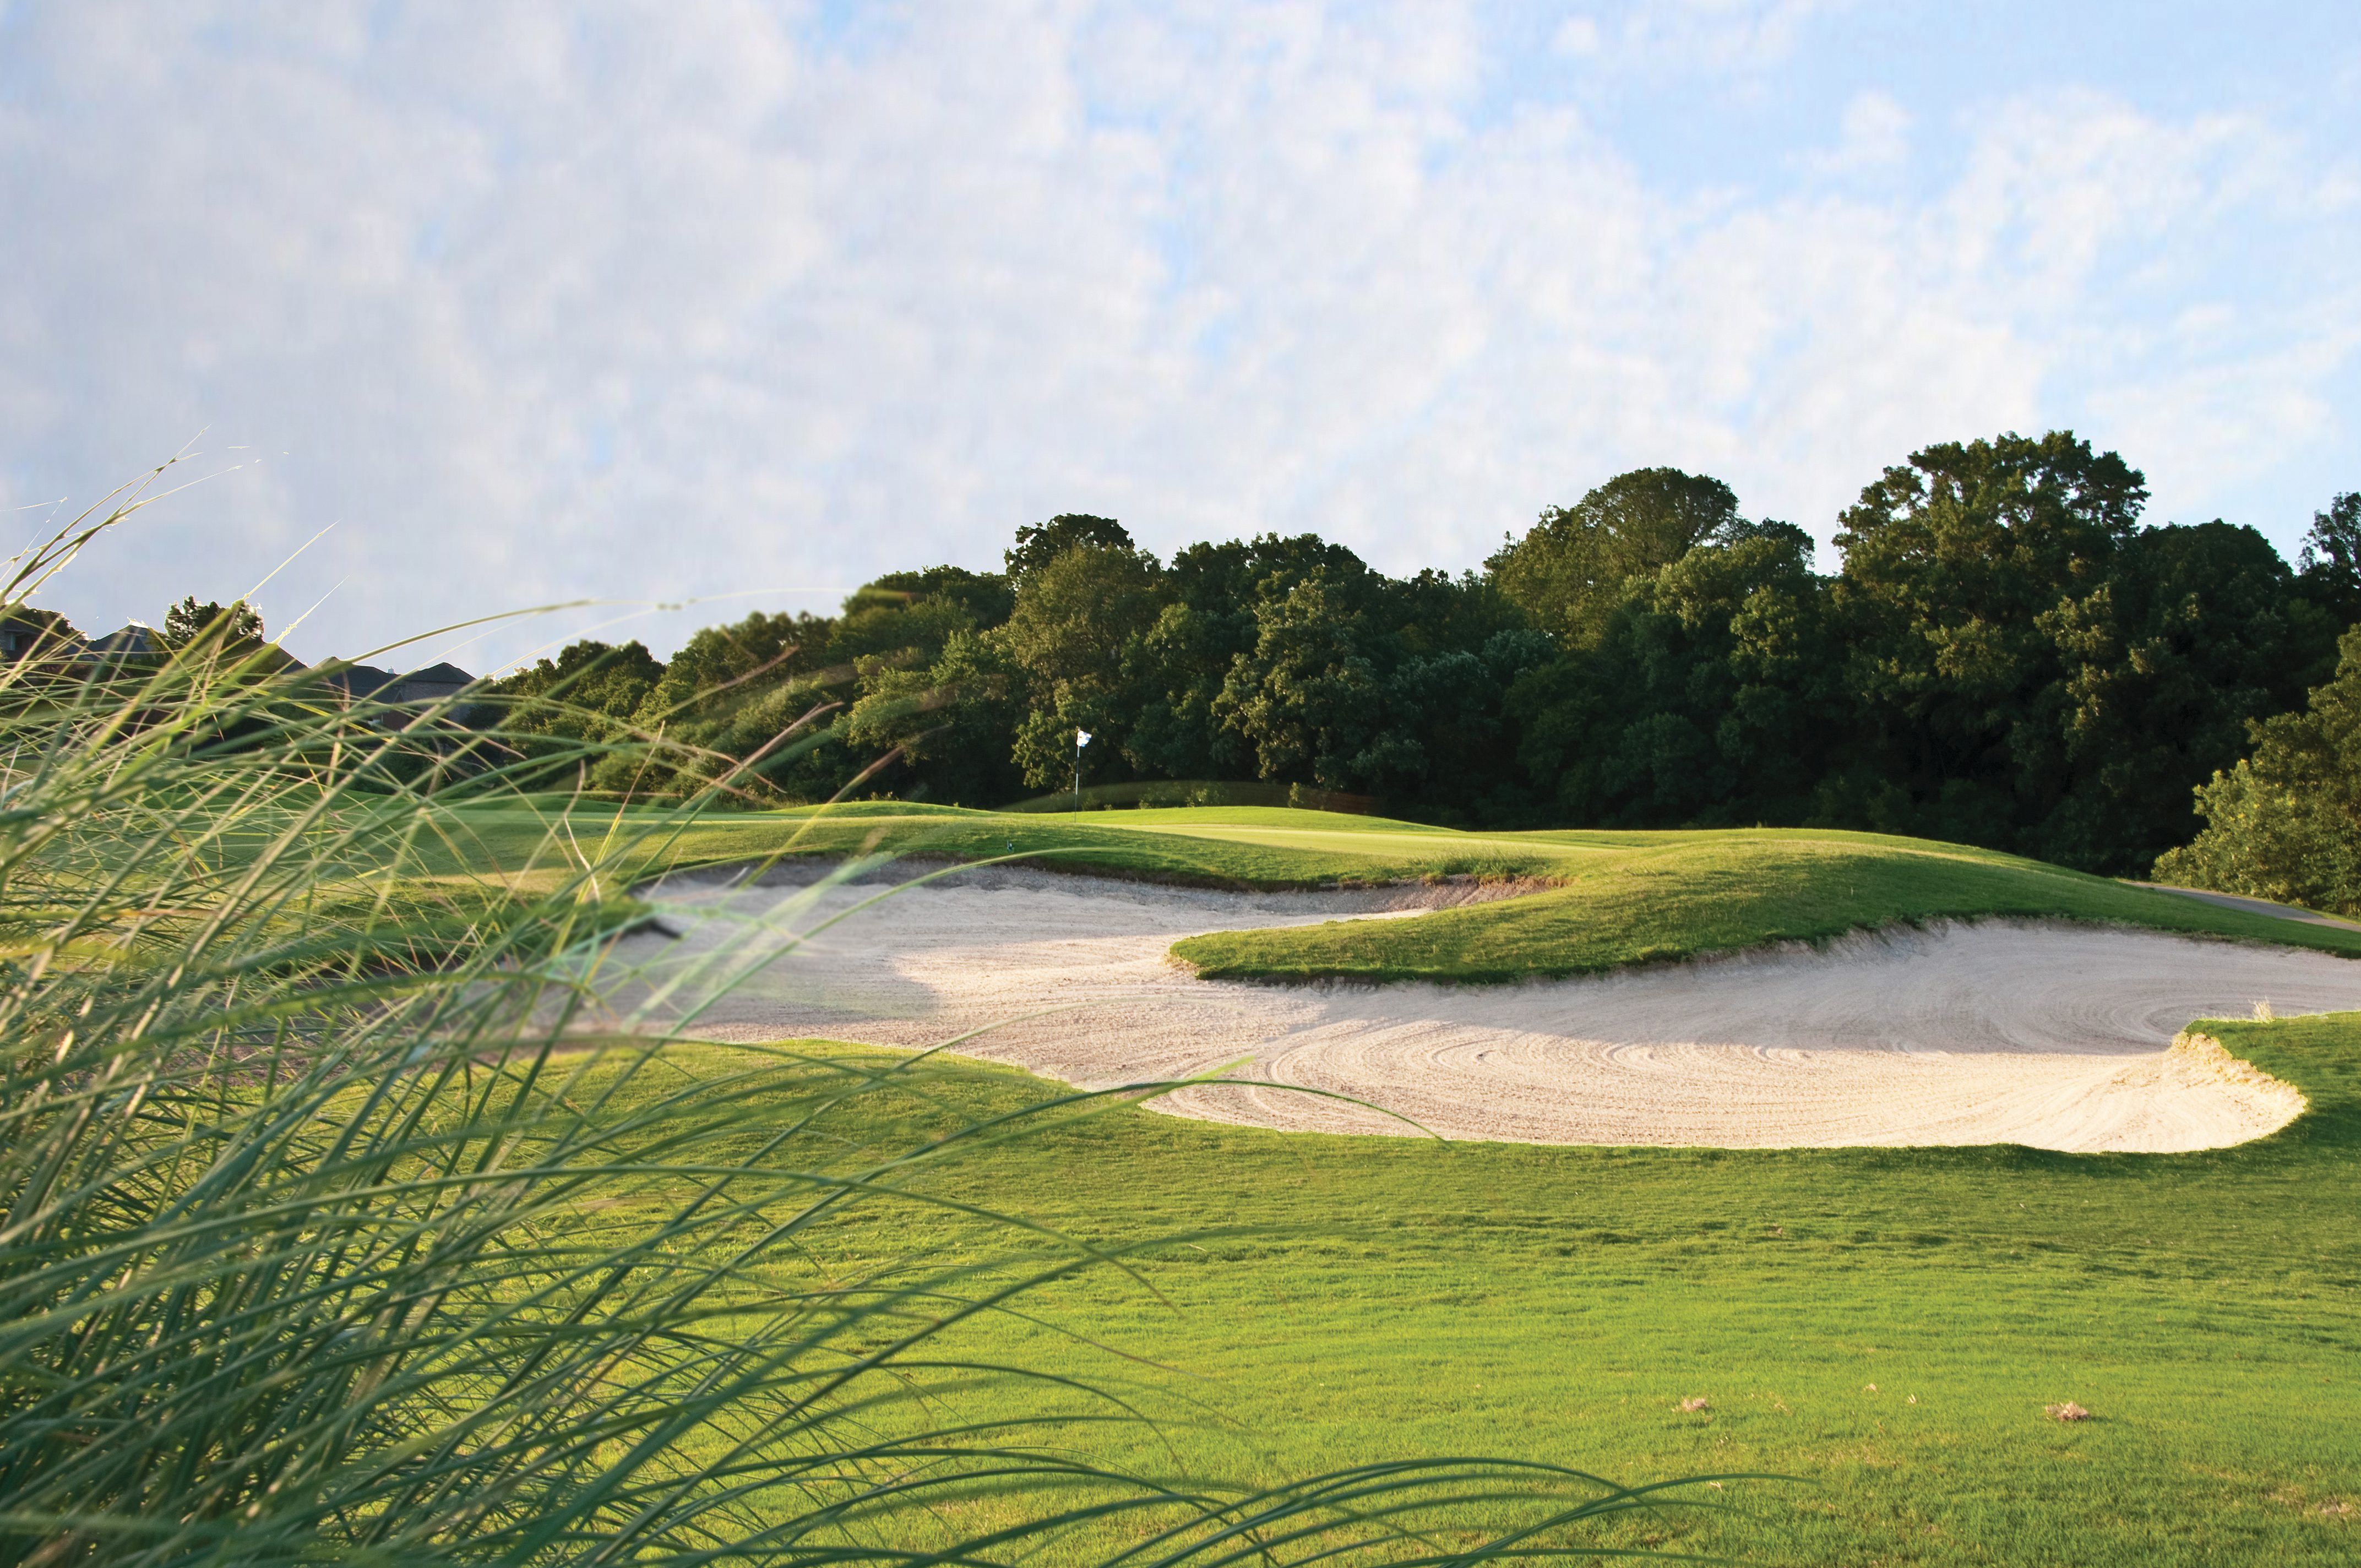
Firewheel Golf Park, City of Garland
By The Numbers
| 2017 | 2022 | |
|---|---|---|
| Population | 440,160 | 470,630 |
| Households | 151,033 | 160,781 |
| Average Household Size | 2.90 | 2.91 |
| Media Age | 35.8 | 36.4 |
| Median Household Income | $64,868 | $71,561 |
| Average Household Income | $86,868 | $96,716 |
| Per Capita Income | $29,988 | $33,207 |
Race and Ethnicity
| 2017 (%) | 2022 (%) | |
|---|---|---|
| White Alone | 256,2399 (58.3%) | 259,486 (55.1%) |
| Black Alone | 57,900 (13.2%) | 63,538 (13.5%) |
| American Indian Alone | 2,891 (0.7%) | 3,048 (0.6%) |
| Asian Alone | 57,667 (13.1%) | 71,320 (15.2%) |
| Pacific Islander Alone | 227 (0.1%) | 269 (0.1%) |
| Some Other Race Alone | 49,240 (11.2%) | 54,748 (11.6%) |
| Two or More Races | 15,835 (3.6%) | 18,221 (3.9%) |
| Hispanic Origin (Any Race) | 133,241 (30.3%) | 150,448 (32.0%) |
Educational Attainment (Population 25+)
| 2017 | |
|---|---|
| TOTAL | 287,813 |
| Less Than 9th Grade | 8.4% |
| 9th-12th Grade, No Diploma | 7.7% |
| High School Graduate | 18.9% |
| GED/Alternative Credential | 3% |
| Some College, No Degree | 21.7% |
| Associate Degree | 7.4% |
| Bachelor’s Degree | 22.2% |
| Graduate/Professional Degree | 10.7% |
Household Expenditures (Average Annual Spend)
| 2017 | |
|---|---|
| TOTAL | $74,594 |
| Food | $9,027 |
| Housing | $22,951 |
| Apparel and Services | $2,382 |
| Transportation | $8,735 |
| Travel | $2,243 |
| Healthcare | $5,806 |
| Entertainment and Recreation | $3,329 |
| Personal Care Products/Services | $863 |
| Education | $1,579 |