Northwest Dallas County
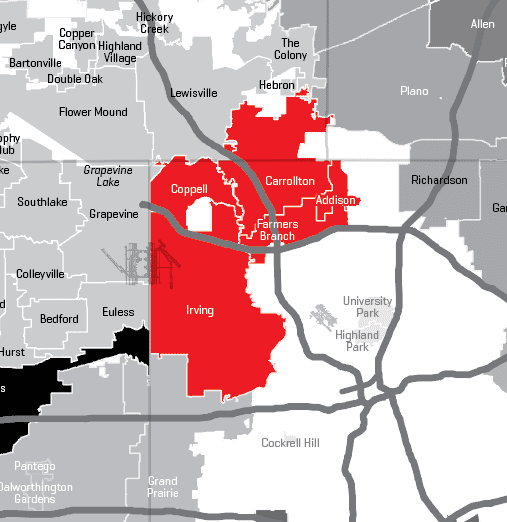
Northwest Dallas County
Northwest Dallas County offers a central location making it easy to commute to almost anywhere in the area, especially Dallas-Fort Worth International Airport – which is one reason so many companies have opted to headquarter here. Within Irving lies Las Colinas, a newer mixed-use, master-planned community with luxury hotels, pretty houses, private clubs, urban lofts and restaurants. The Town of Addison is a favorite of young, single, people who enjoy the abundant nightlife, the proximity to shopping, easy access to the Dallas North Tollway, and jobs galore.
Northwest Dallas County Communities

Addison Kaboom Town 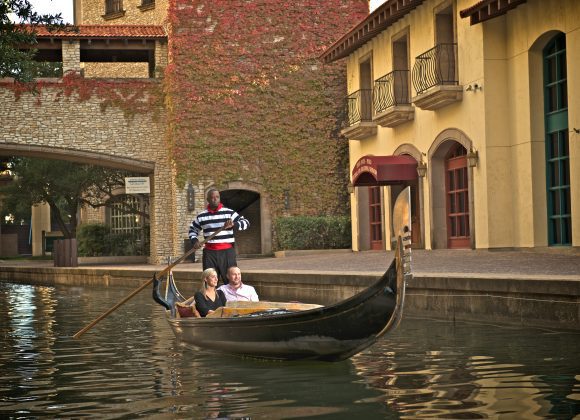
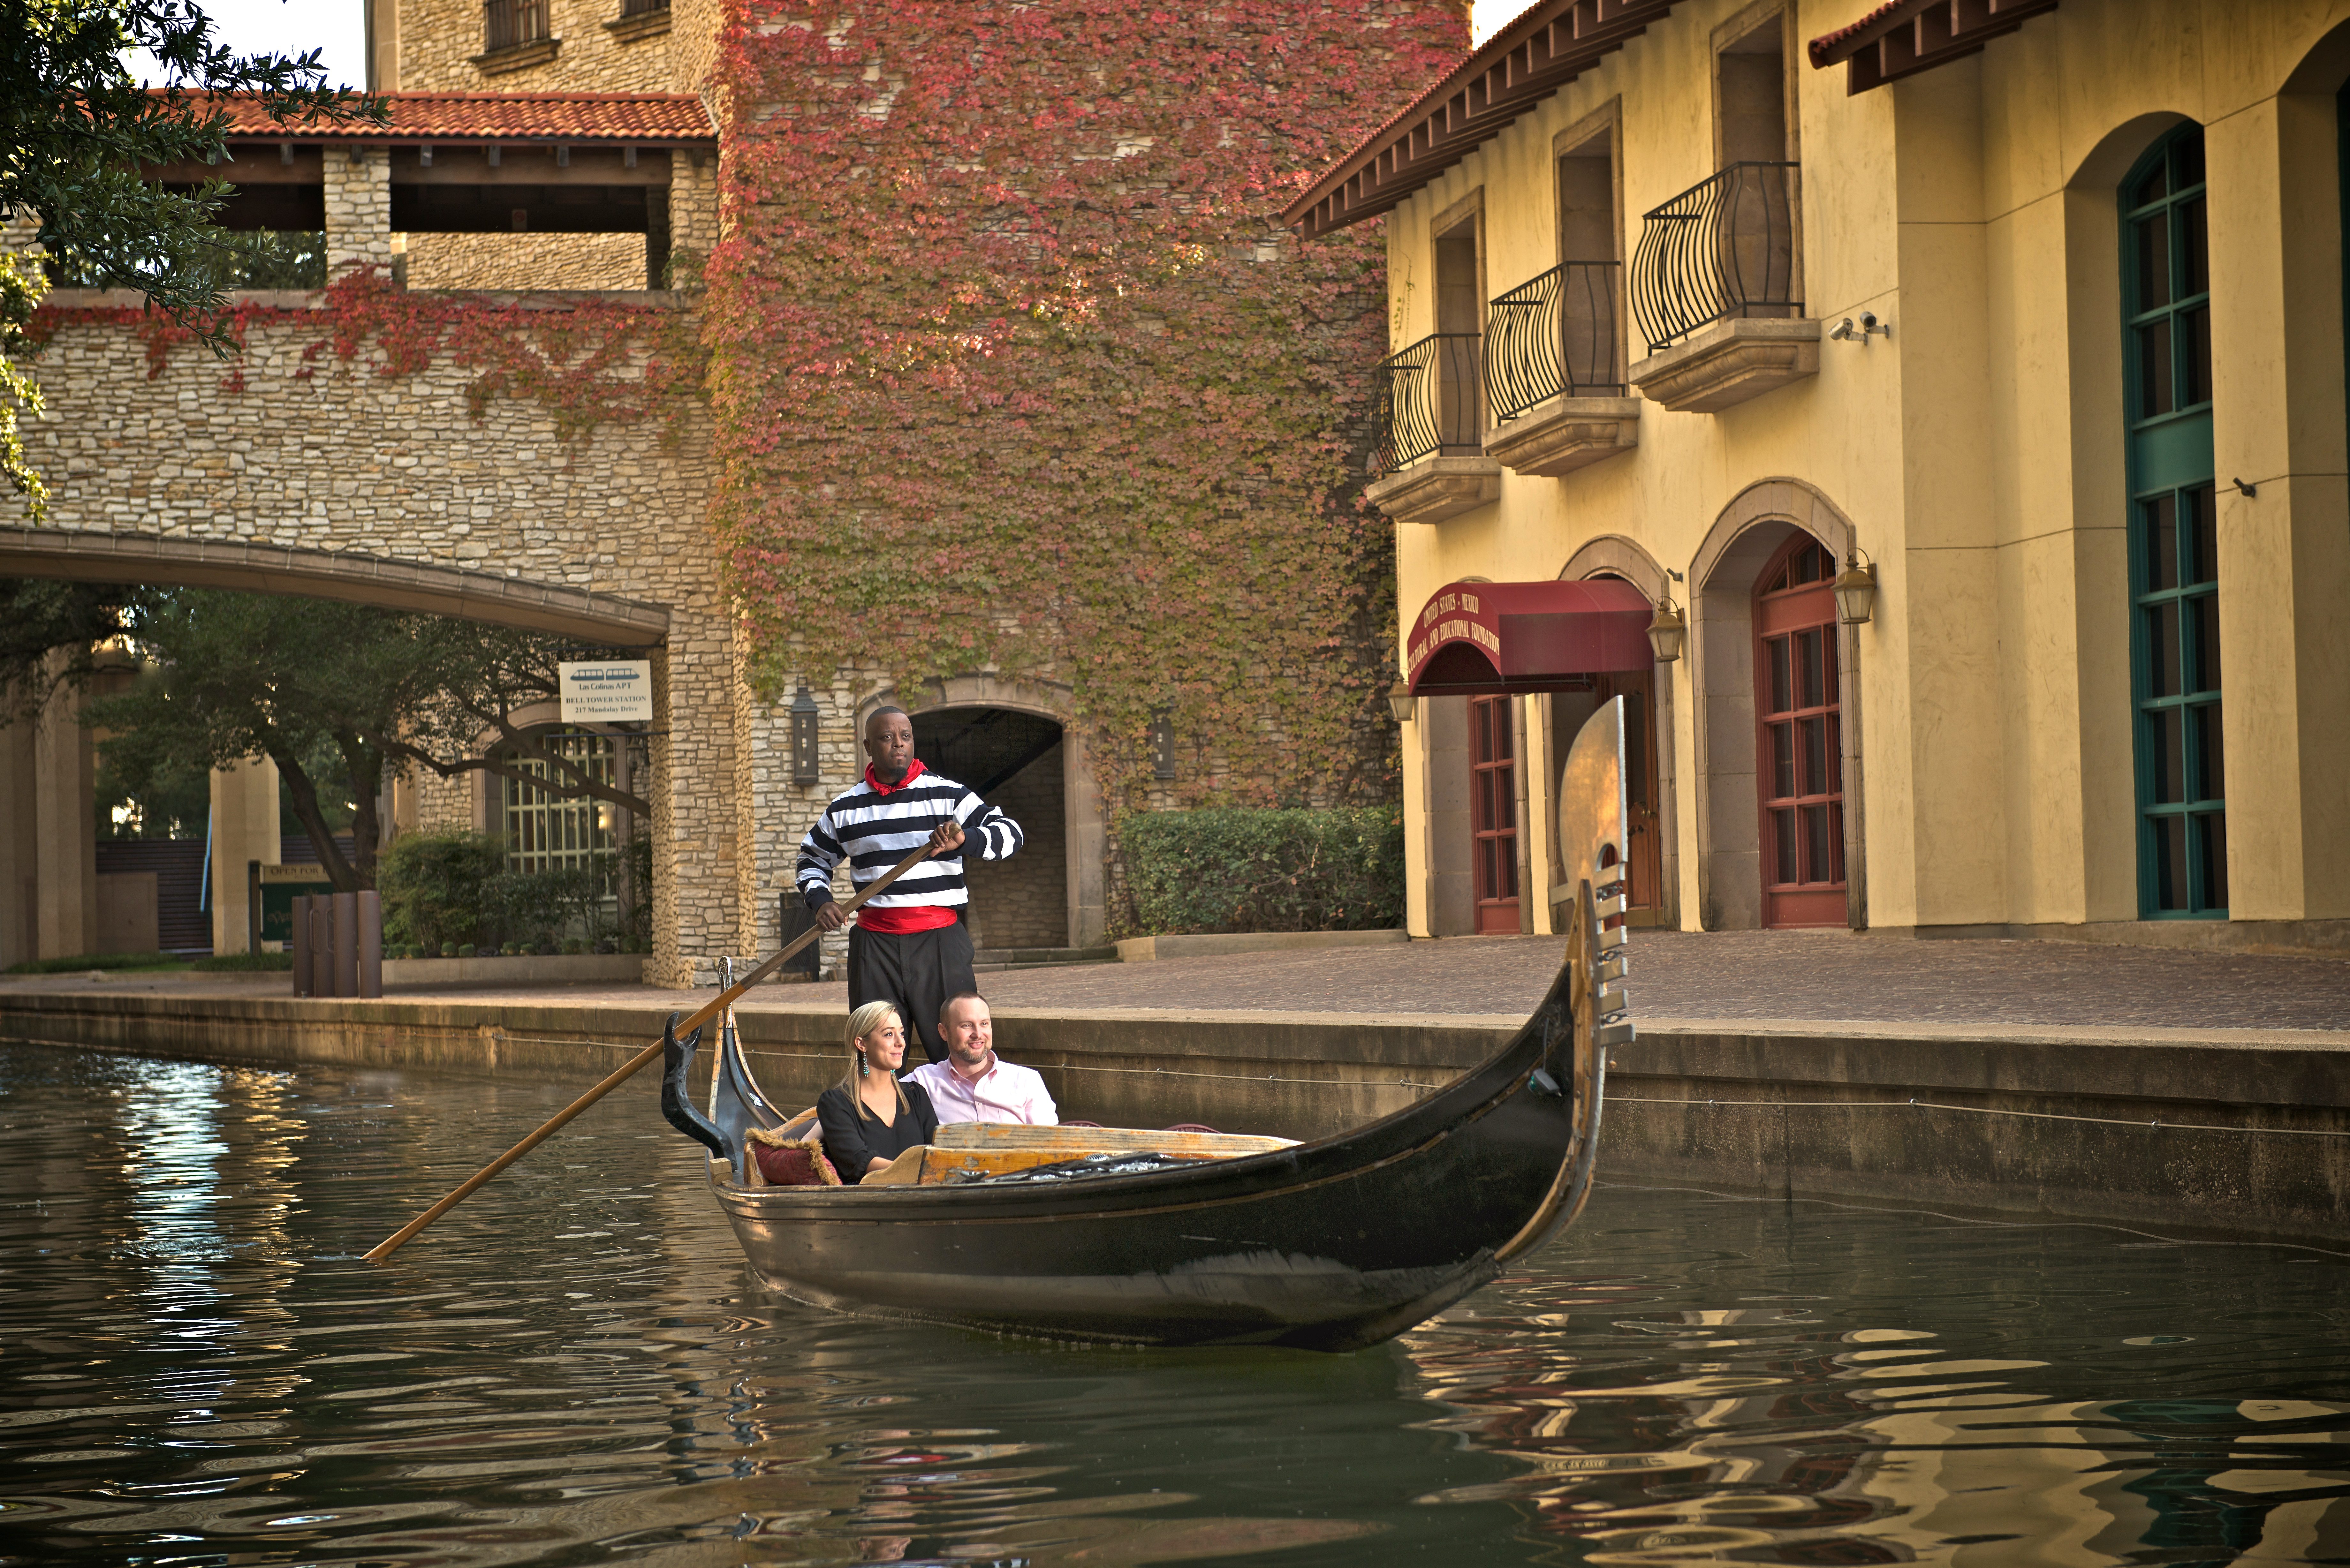
Irving - Las Colinas Canals 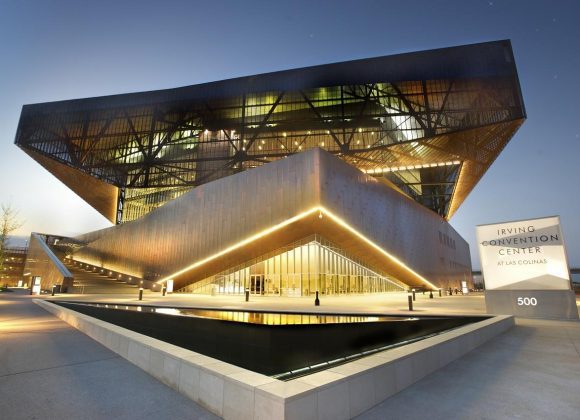
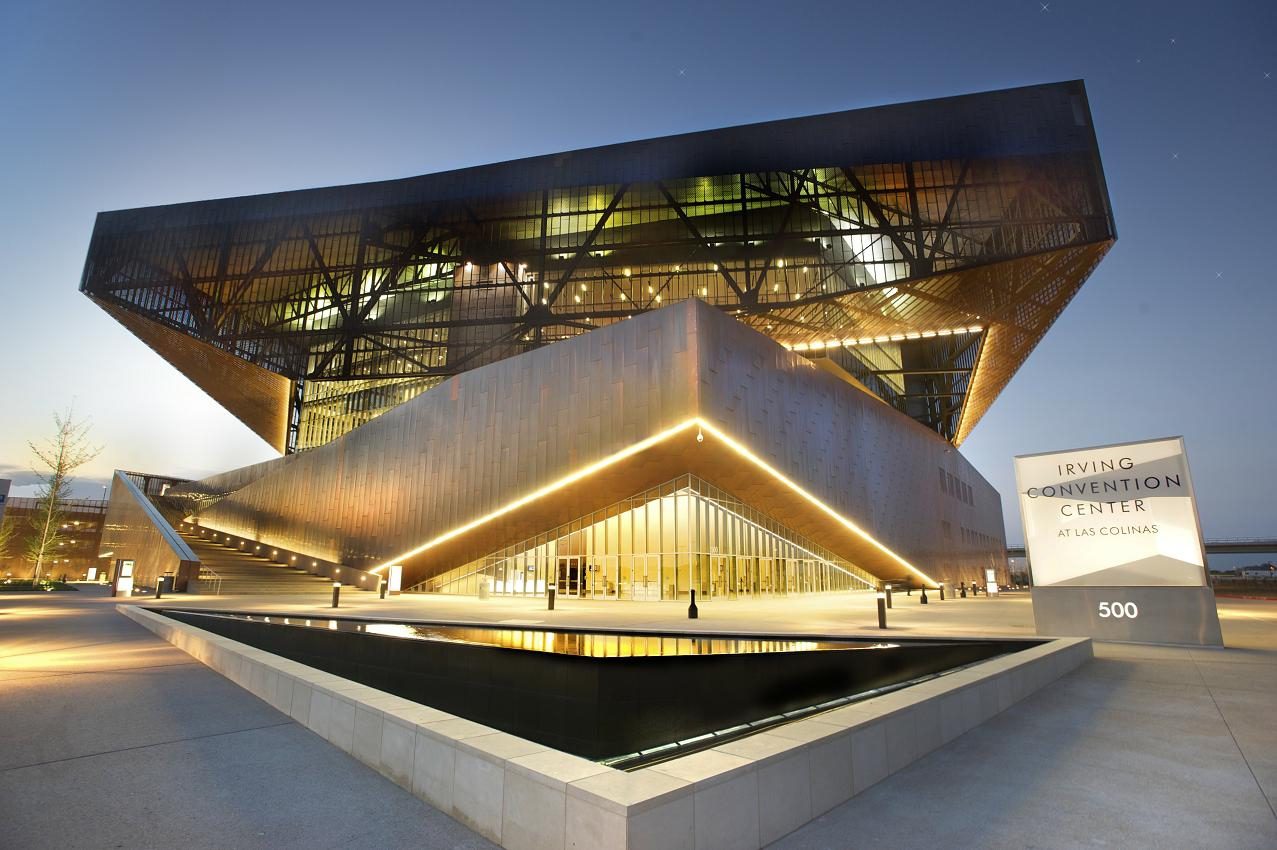
Irving Convention Center 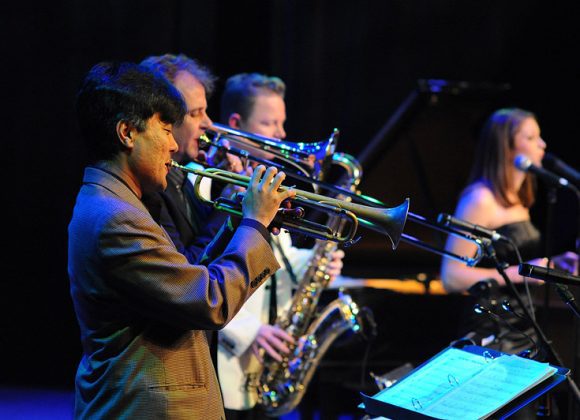
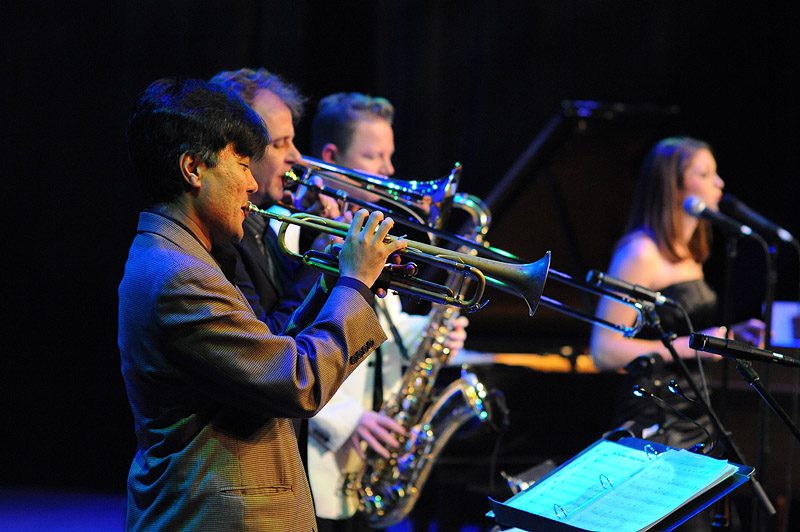
Corner Pocket Music - Addison

By The Numbers
| 2017 | 2022 | |
|---|---|---|
| Population | 447,467 | 479,987 |
| Households | 169,199 | 181,134 |
| Average Household Size | 2.64 | 2.64 |
| Media Age | 34.0 | 34.5 |
| Median Household Income | $60,890 | $67,808 |
| Average Household Income | $86,485 | $93,069 |
| Per Capita Income | $32,846 | $35,255 |
Race and Ethnicity
| 2017 (%) | 2022 (%) | |
|---|---|---|
| White Alone | 248,937 (55.6%) | 250,849 (52.3%) |
| Black Alone | 46,796 (10.5%) | 51,967 (10.8%) |
| American Indian Alone | 3,054 (0.7%) | 3,227 (0.7%) |
| Asian Alone | 71,347 (15.9%) | 87,918 (18.3%) |
| Pacific Islander Alone | 413 (0.1%) | 467 (0.1%) |
| Some Other Race Alone | 60,822 (13.6%) | 67,201 (14.0%) |
| Two or More Races | 16,097 (3.6%) | 18,361 (3.8%) |
| Hispanic Origin (Any Race) | 162,973 (36.4%) | 182,047 (37.9%) |
Educational Attainment (Population 25+)
| 2017 | |
|---|---|
| TOTAL | 292,811 |
| Less Than 9th Grade | 8.3% |
| 9th-12th Grade, No Diploma | 7.1% |
| High School Graduate | 17.0% |
| GED/Alternative Credential | 2.4% |
| Some College, No Degree | 19.5% |
| Associate Degree | 6.2% |
| Bachelor’s Degree | 25.4% |
| Graduate/Professional Degree | 14.1% |
Household Expenditures (Average Annual Spend)
| 2017 | |
|---|---|
| TOTAL | $78,836 |
| Food | $9,736 |
| Housing | $24,649 |
| Apparel and Services | $2,562 |
| Transportation | $9,248 |
| Travel | $2,307 |
| Healthcare | $5,862 |
| Entertainment and Recreation | $3,479 |
| Personal Care Products/Services | $915 |
| Education | $1,717 |