Allen
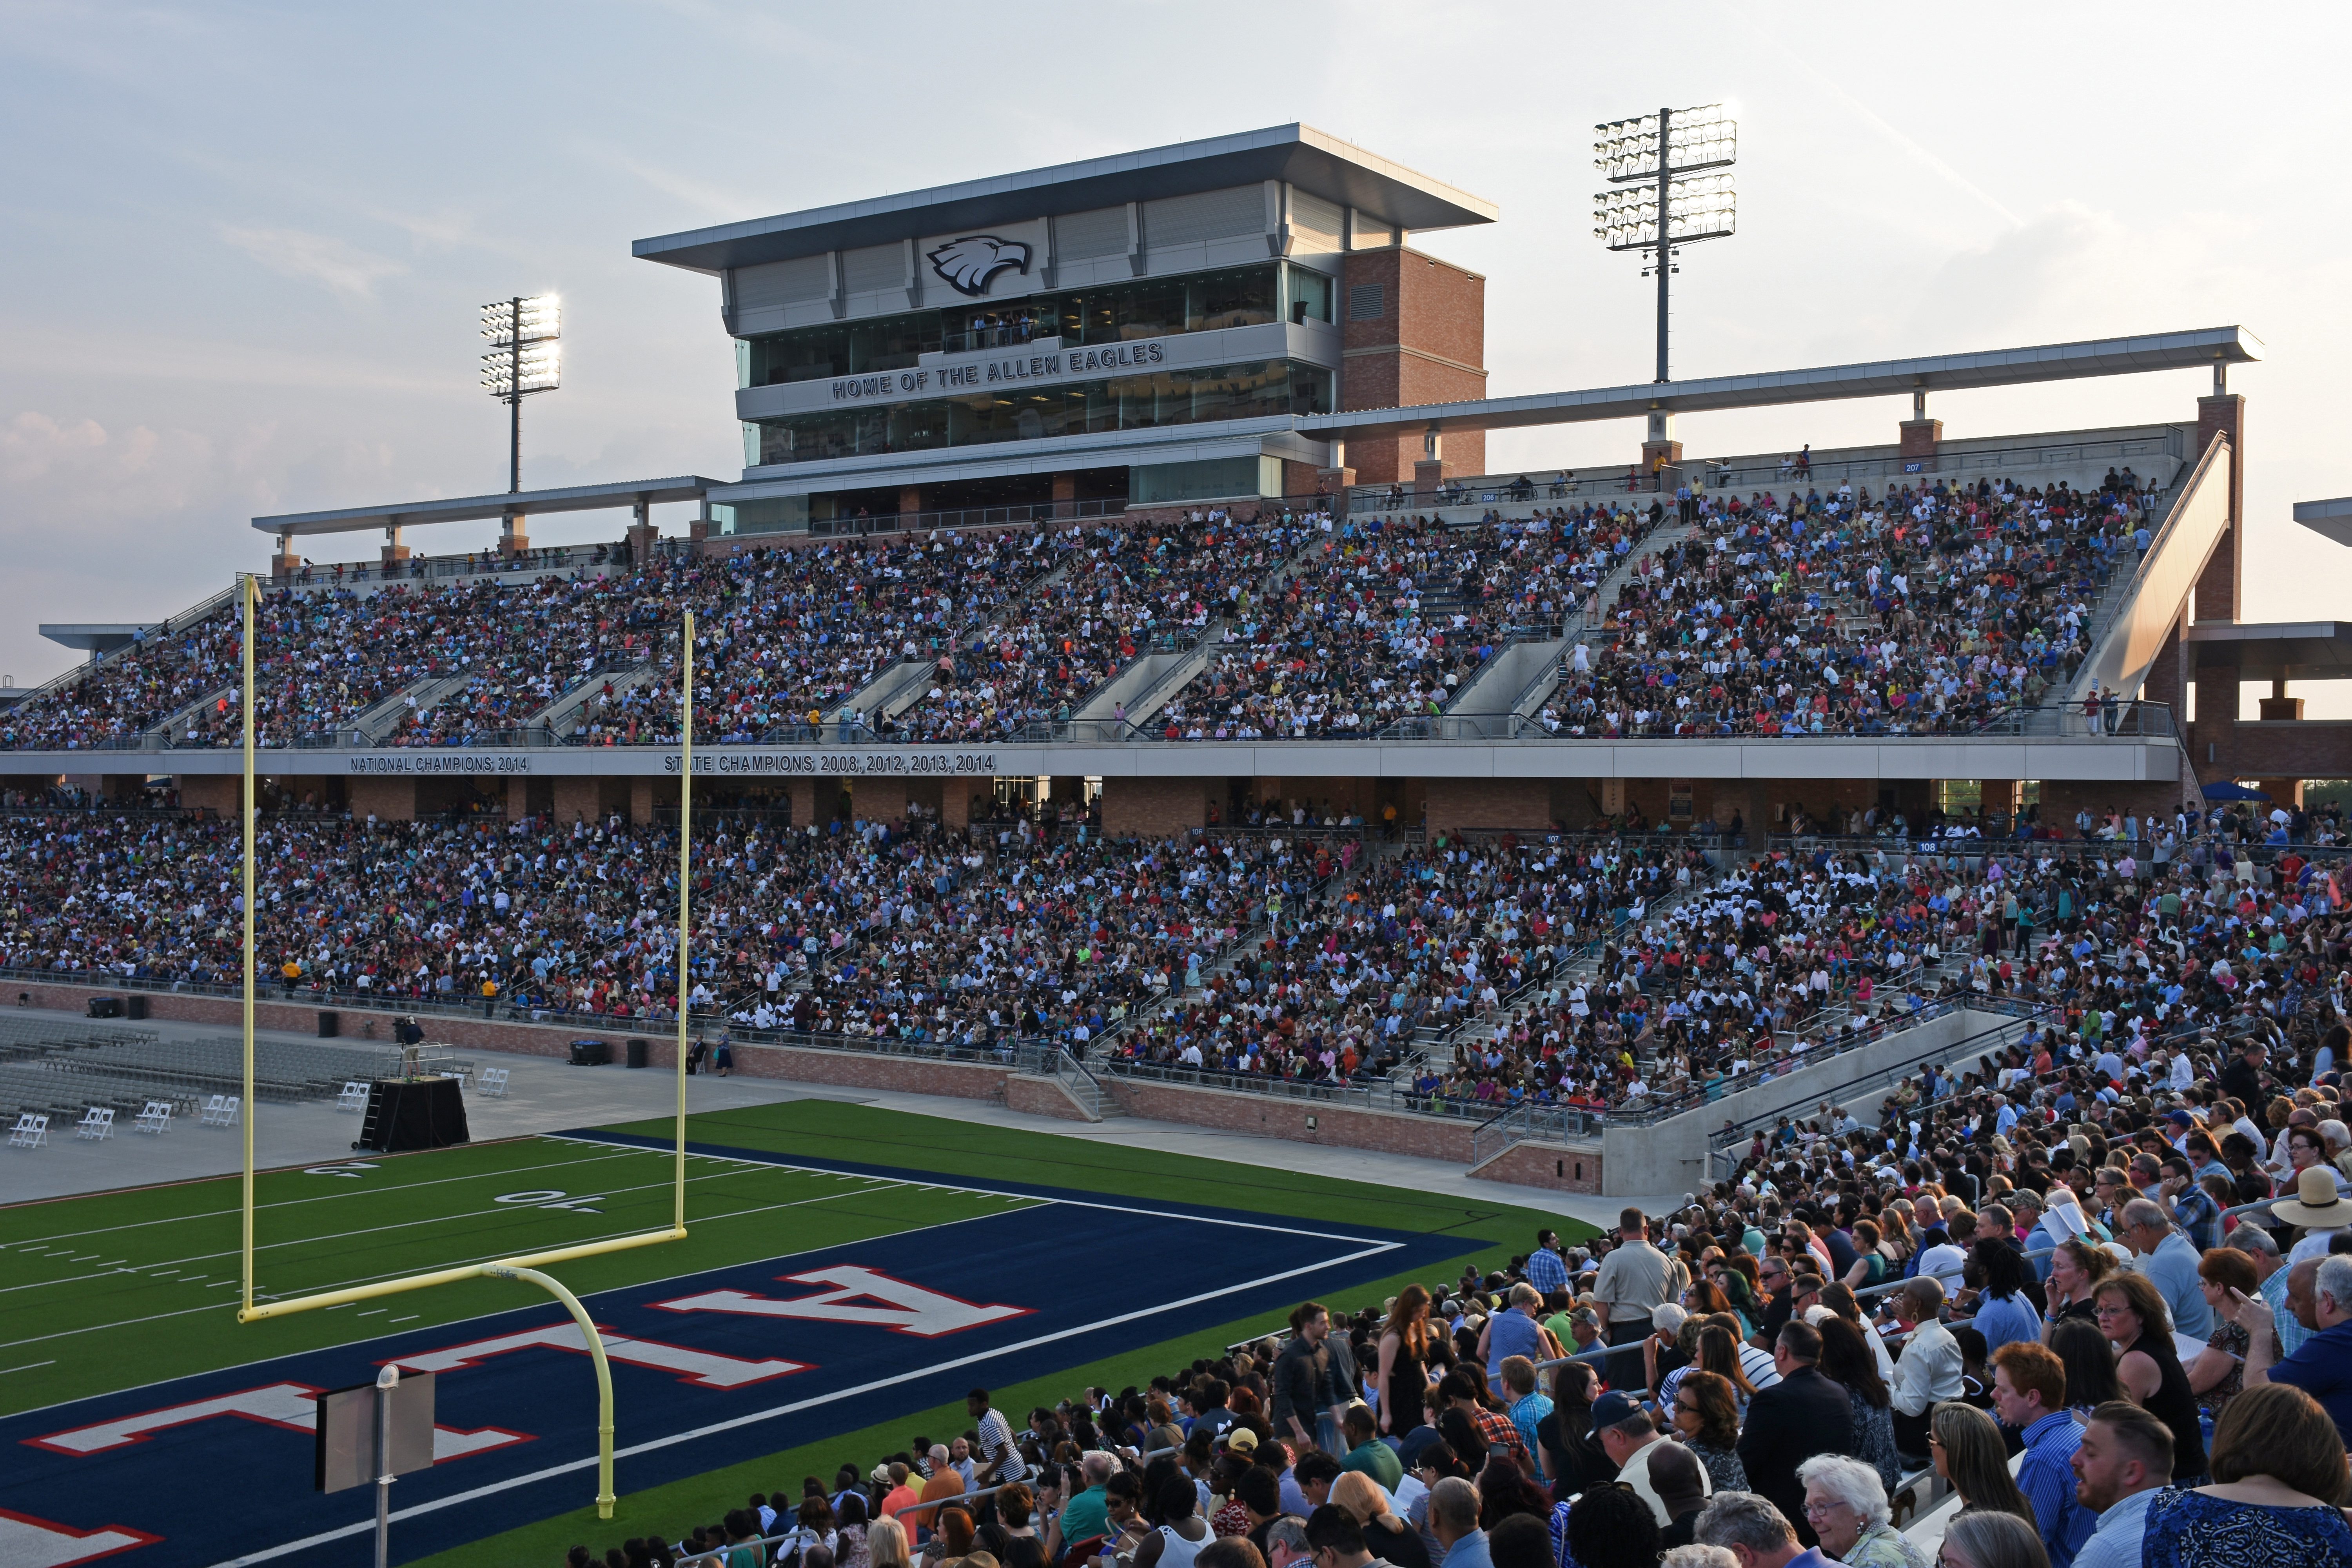
This wholesome community was newly built for families. Allen ISD has the largest high school in Texas with an enrollment of over 6,000 students. Their football stadium rivals professional operations with seating capacity for 18,000. The Eagles were football state champions in 2017, 2014 and three years prior. But the entertainment isn’t all about Friday night lights. Allen Event Center puts on major concerts and national shows. Hydrous Wake Park keeps the kids cool, as does KidMania, one of the largest handicapped-accessible playgrounds and spray grounds in Texas. Watters Creek offers fun times and shopping all in one.
Allen By the Numbers
| 2023 | |
|---|---|
| Population | 111,963 |
| Households | 38,661 |
| Median Age | 36 |
| Median Household Income | 115,844 |
| 2023 | Percent | |
|---|---|---|
| White Alone | 55,957 | 54.7% |
| Black Alone | 9,805 | 9.6% |
| American Indian Alone | 91 | 0.1% |
| Asian Alone | 19,529 | 19.1% |
| Some Other Race Alone | 638 | 0.6% |
| Two or More Races | 4,806 | 4.7% |
| Hispanic Origin (any race) | 11,490 | 11.2% |
| 2023 | |
|---|---|
| TOTAL | 66,659 |
| Less Than 9th Grade | 1.4% |
| 9th-12th Grade - No Diploma | 2.6% |
| High School Graduate | 19.7% |
| GED/ Alternative Credential | 1.7% |
| Some College - No Degree | 19.7% |
| Associate Degree | 7.7% |
| Bachelor's Degree | 34.0% |
| Graduate/ Professional Degree | 2.3% |