Arlington
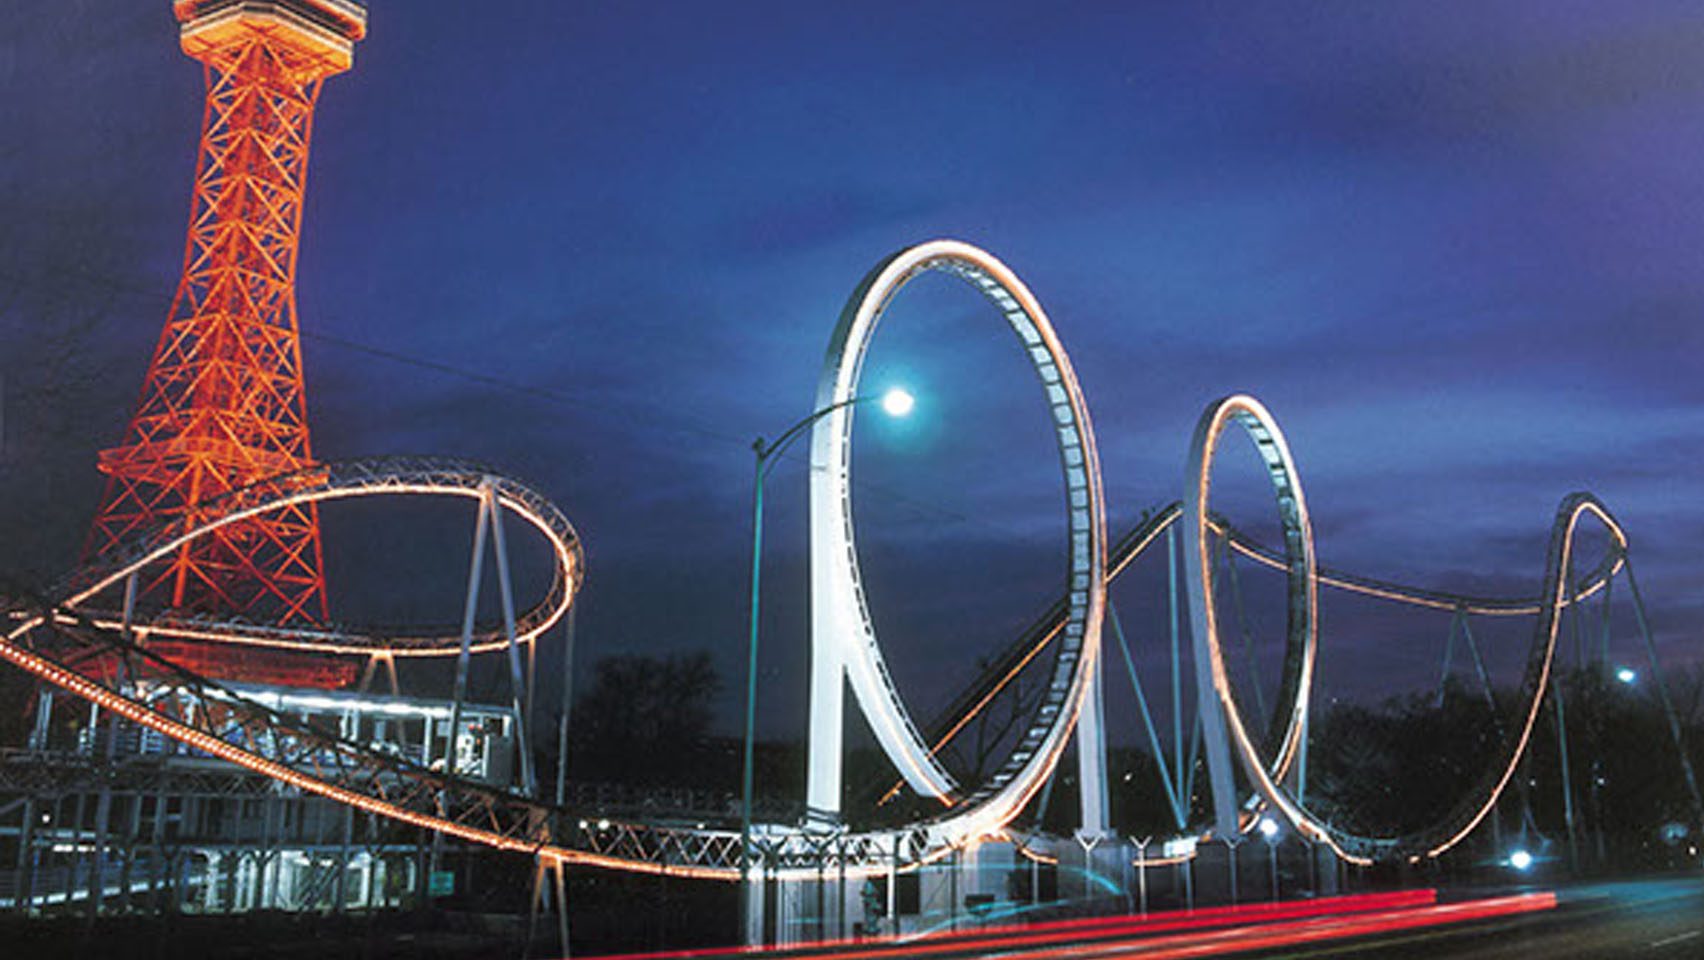
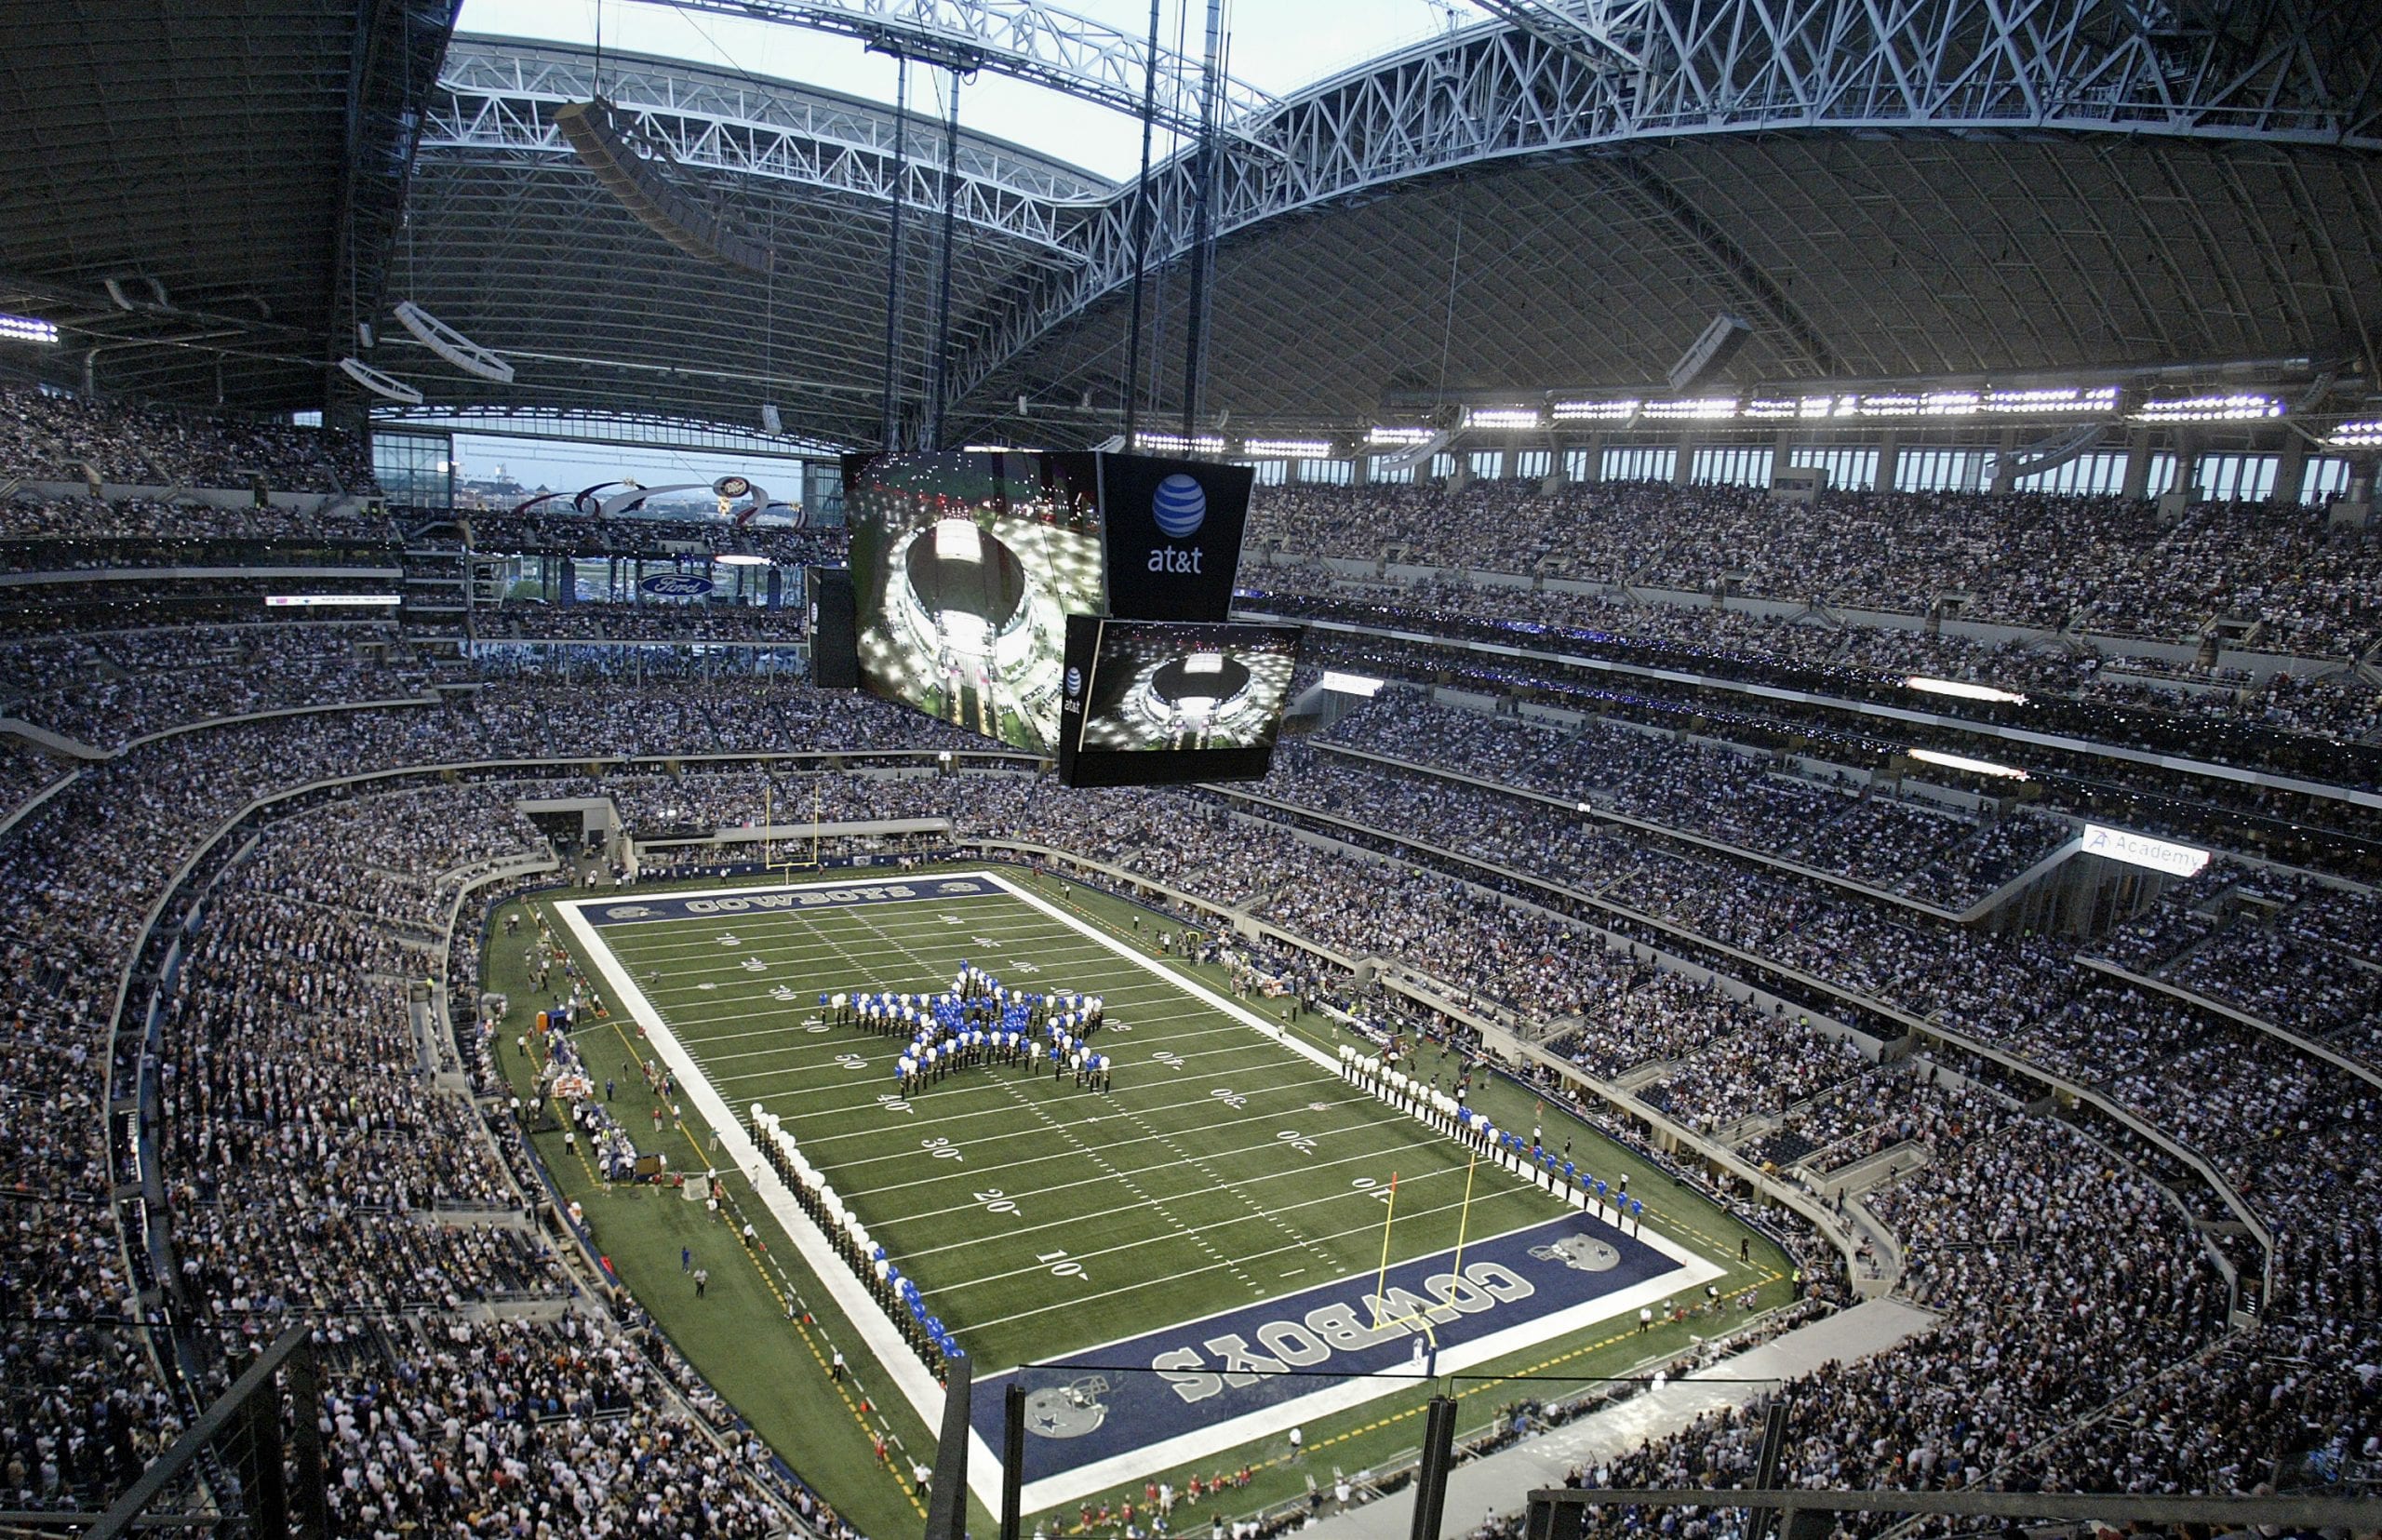
Arlington is located in the center of the Dallas Region just 10 miles east of Fort Worth and 20 miles west of Dallas. Arlington officials like to say that the city was built on two words: “We can.” And here you can see a Texas Rangers game, attend a Dallas Cowboys football game, ride a roller coaster at Six Flags Over Texas, or shoot down a water flume at Hurricane Harbor. You can enjoy River Legacy Park’s 1,300 acres of urban forests and greenbelts that follow the curves of the Trinity River.
Arlington By the Numbers
| 2023 | |
|---|---|
| Population | 398,720 |
| Households | 144,533 |
| Median Age | 34 |
| Median Household Income | 65,123 |
| 2023 | Percent | |
|---|---|---|
| White Alone | 147,899 | 37.6% |
| Black Alone | 87,466 | 22.3% |
| American Indian Alone | 616 | 0.2% |
| Asian Alone | 25,918 | 6.6% |
| Some Other Race Alone | 1,440 | 0.4% |
| Two or More Races | 10,626 | 2.7% |
| Hispanic Origin (any race) | 117,694 | 30.0% |
| 2023 | |
|---|---|
| TOTAL | 247,798 |
| Less Than 9th Grade | 7.0% |
| 9th-12th Grade - No Diploma | 7.6% |
| High School Graduate | 22.4% |
| GED/ Alternative Credential | 3.7% |
| Some College - No Degree | 22.4% |
| Associate Degree | 7.8% |
| Bachelor's Degree | 21.1% |
| Graduate/ Professional Degree | 1.2% |