Garland
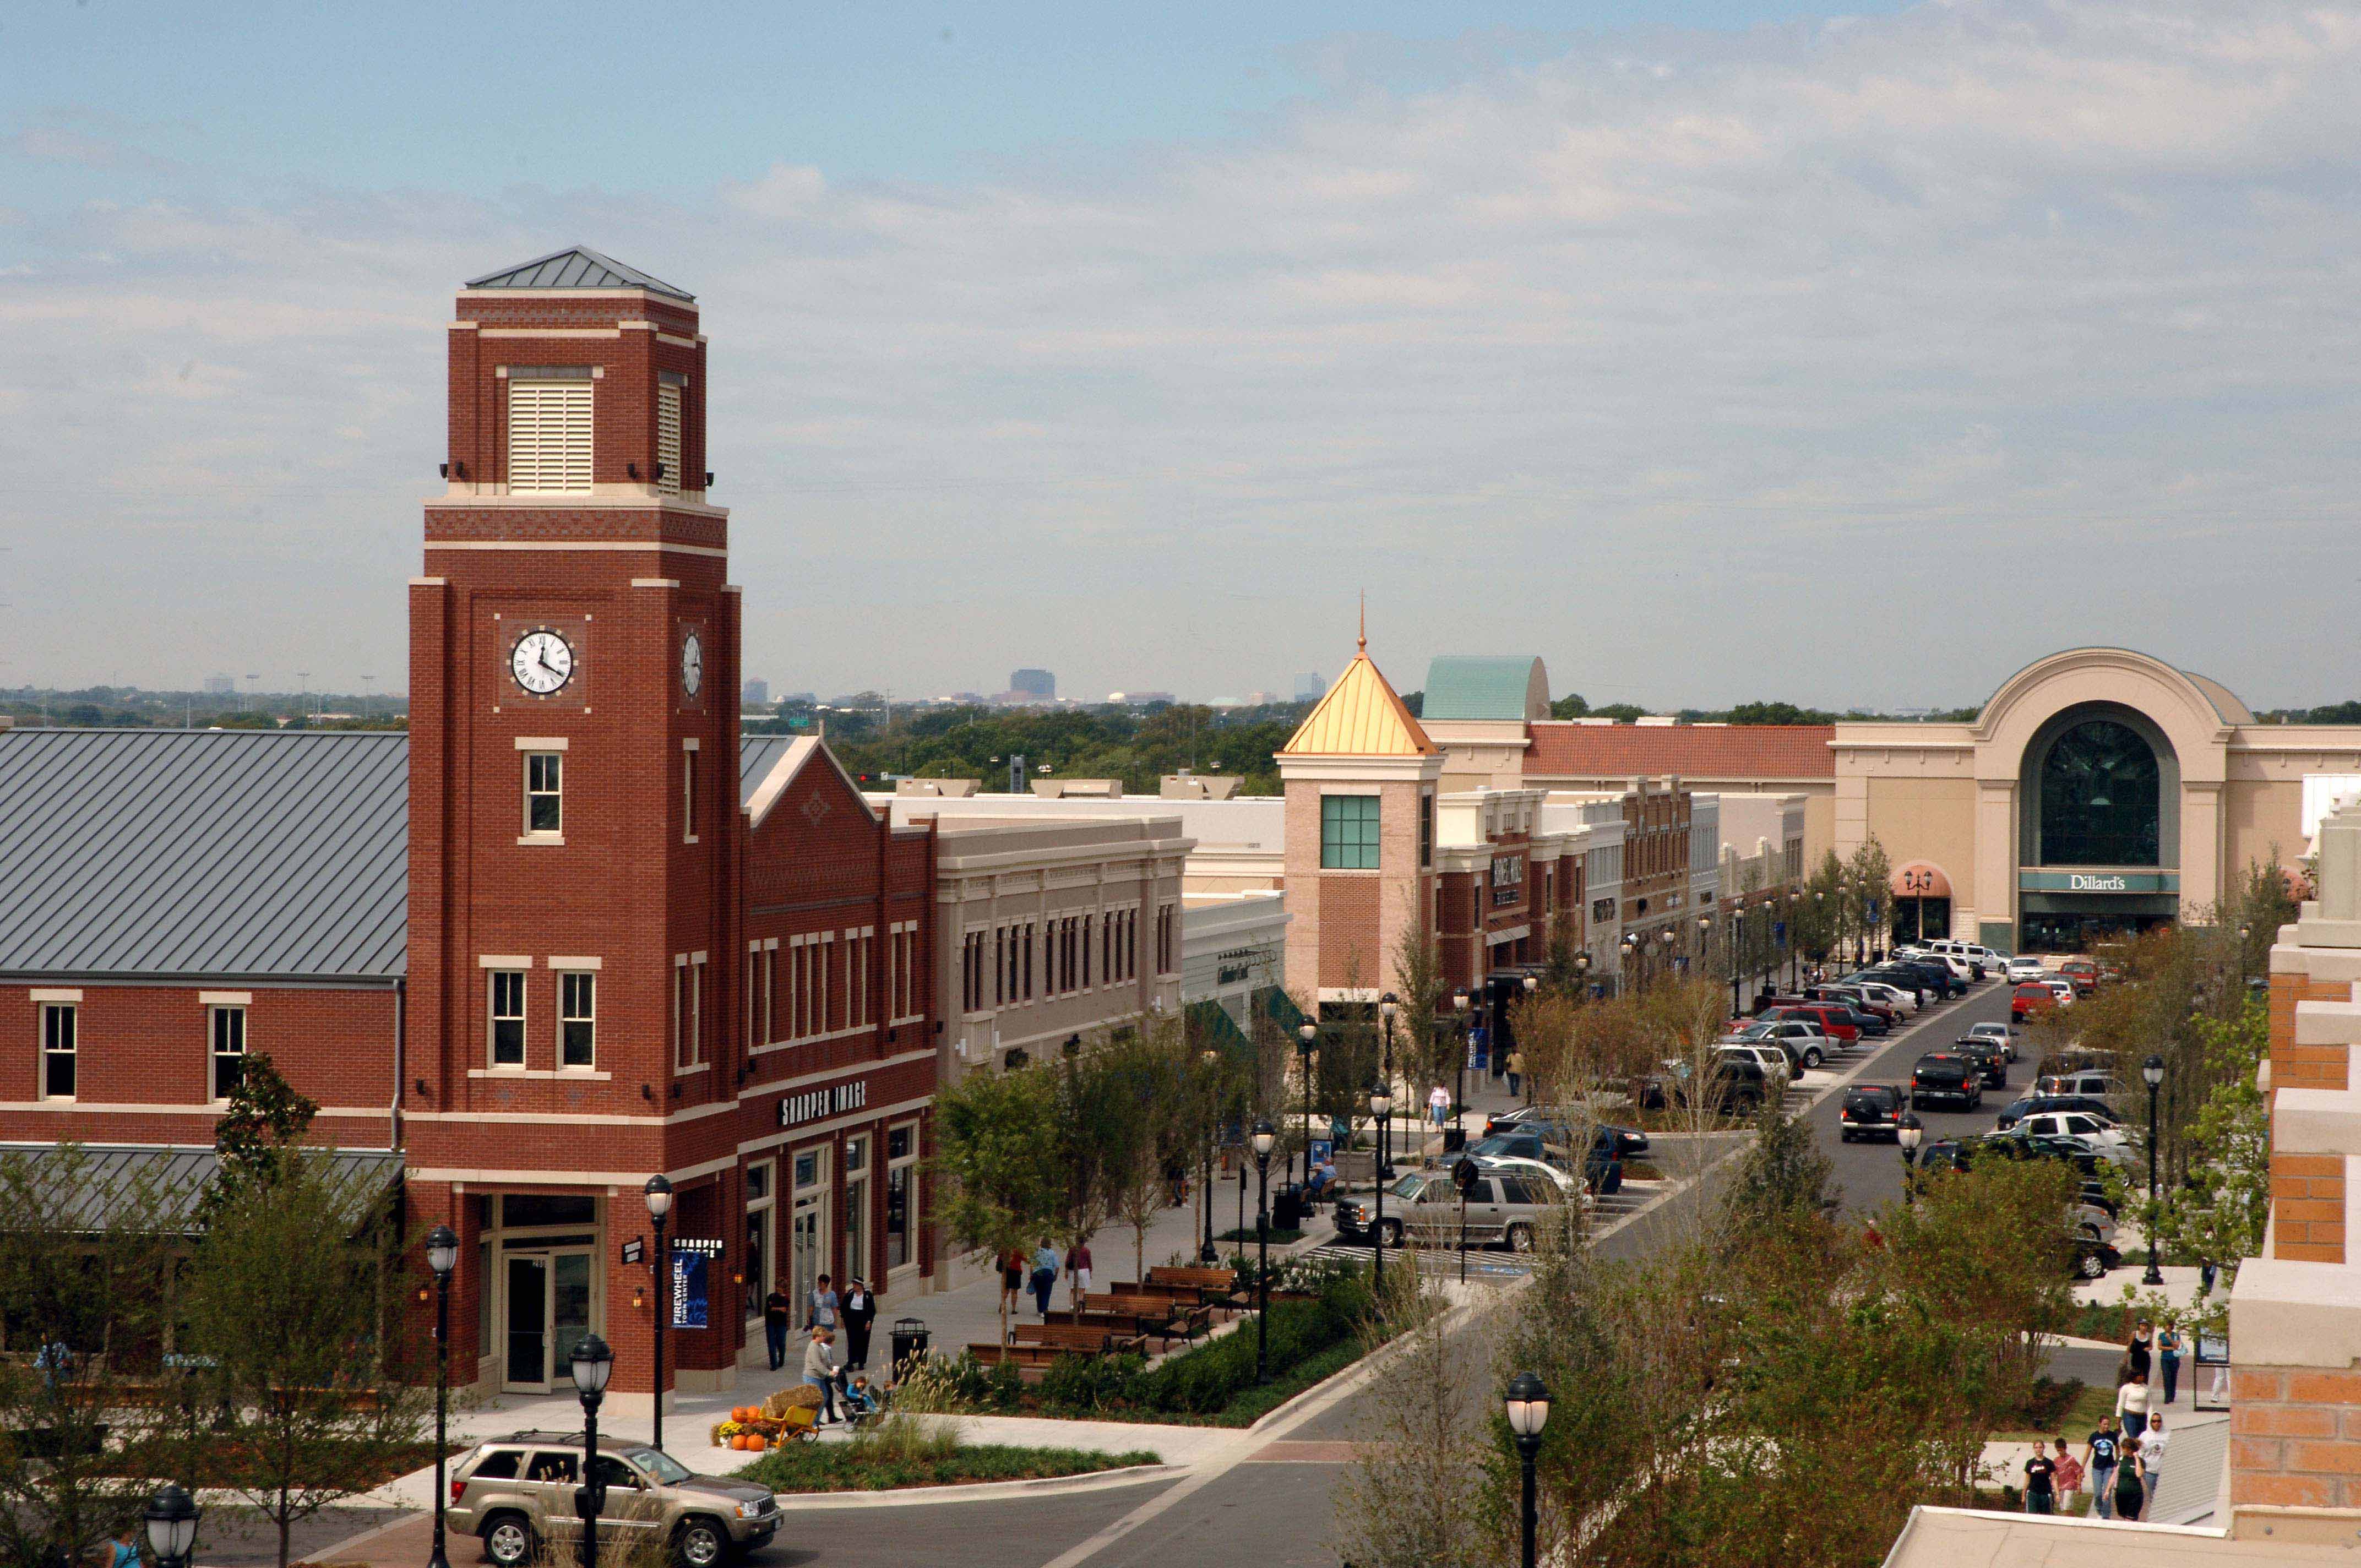


The city of Garland website states that “Garland is where things are made.” What things, you ask? Kraft foods, Resistol hats, and a variety of electronics, oilfield equipment, and aluminum parts. It’s an older city with many affordable single-family homes and apartments. The area is quite ethnically diverse with a sizeable Vietnamese population and has made “best” lists for its appeal to both retirees and working parents.
Garland By the Numbers
| 2023 | |
|---|---|
| Population | 249,776 |
| Households | 83,841 |
| Median Age | 36 |
| Median Household Income | 66,134 |
| 2023 | Percent | |
|---|---|---|
| White Alone | 66,777 | 27.2% |
| Black Alone | 36,750 | 15.0% |
| American Indian Alone | 599 | 0.2% |
| Asian Alone | 26,514 | 10.8% |
| Some Other Race Alone | 1,348 | 0.5% |
| Two or More Races | 7,501 | 3.1% |
| Hispanic Origin (any race) | 105,679 | 43.1% |
| 2023 | |
|---|---|
| TOTAL | 155,509 |
| Less Than 9th Grade | 11.5% |
| 9th-12th Grade - No Diploma | 10.3% |
| High School Graduate | 22.9% |
| GED/ Alternative Credential | 3.2% |
| Some College - No Degree | 22.9% |
| Associate Degree | 7.8% |
| Bachelor's Degree | 15.1% |
| Graduate/ Professional Degree | 1.0% |