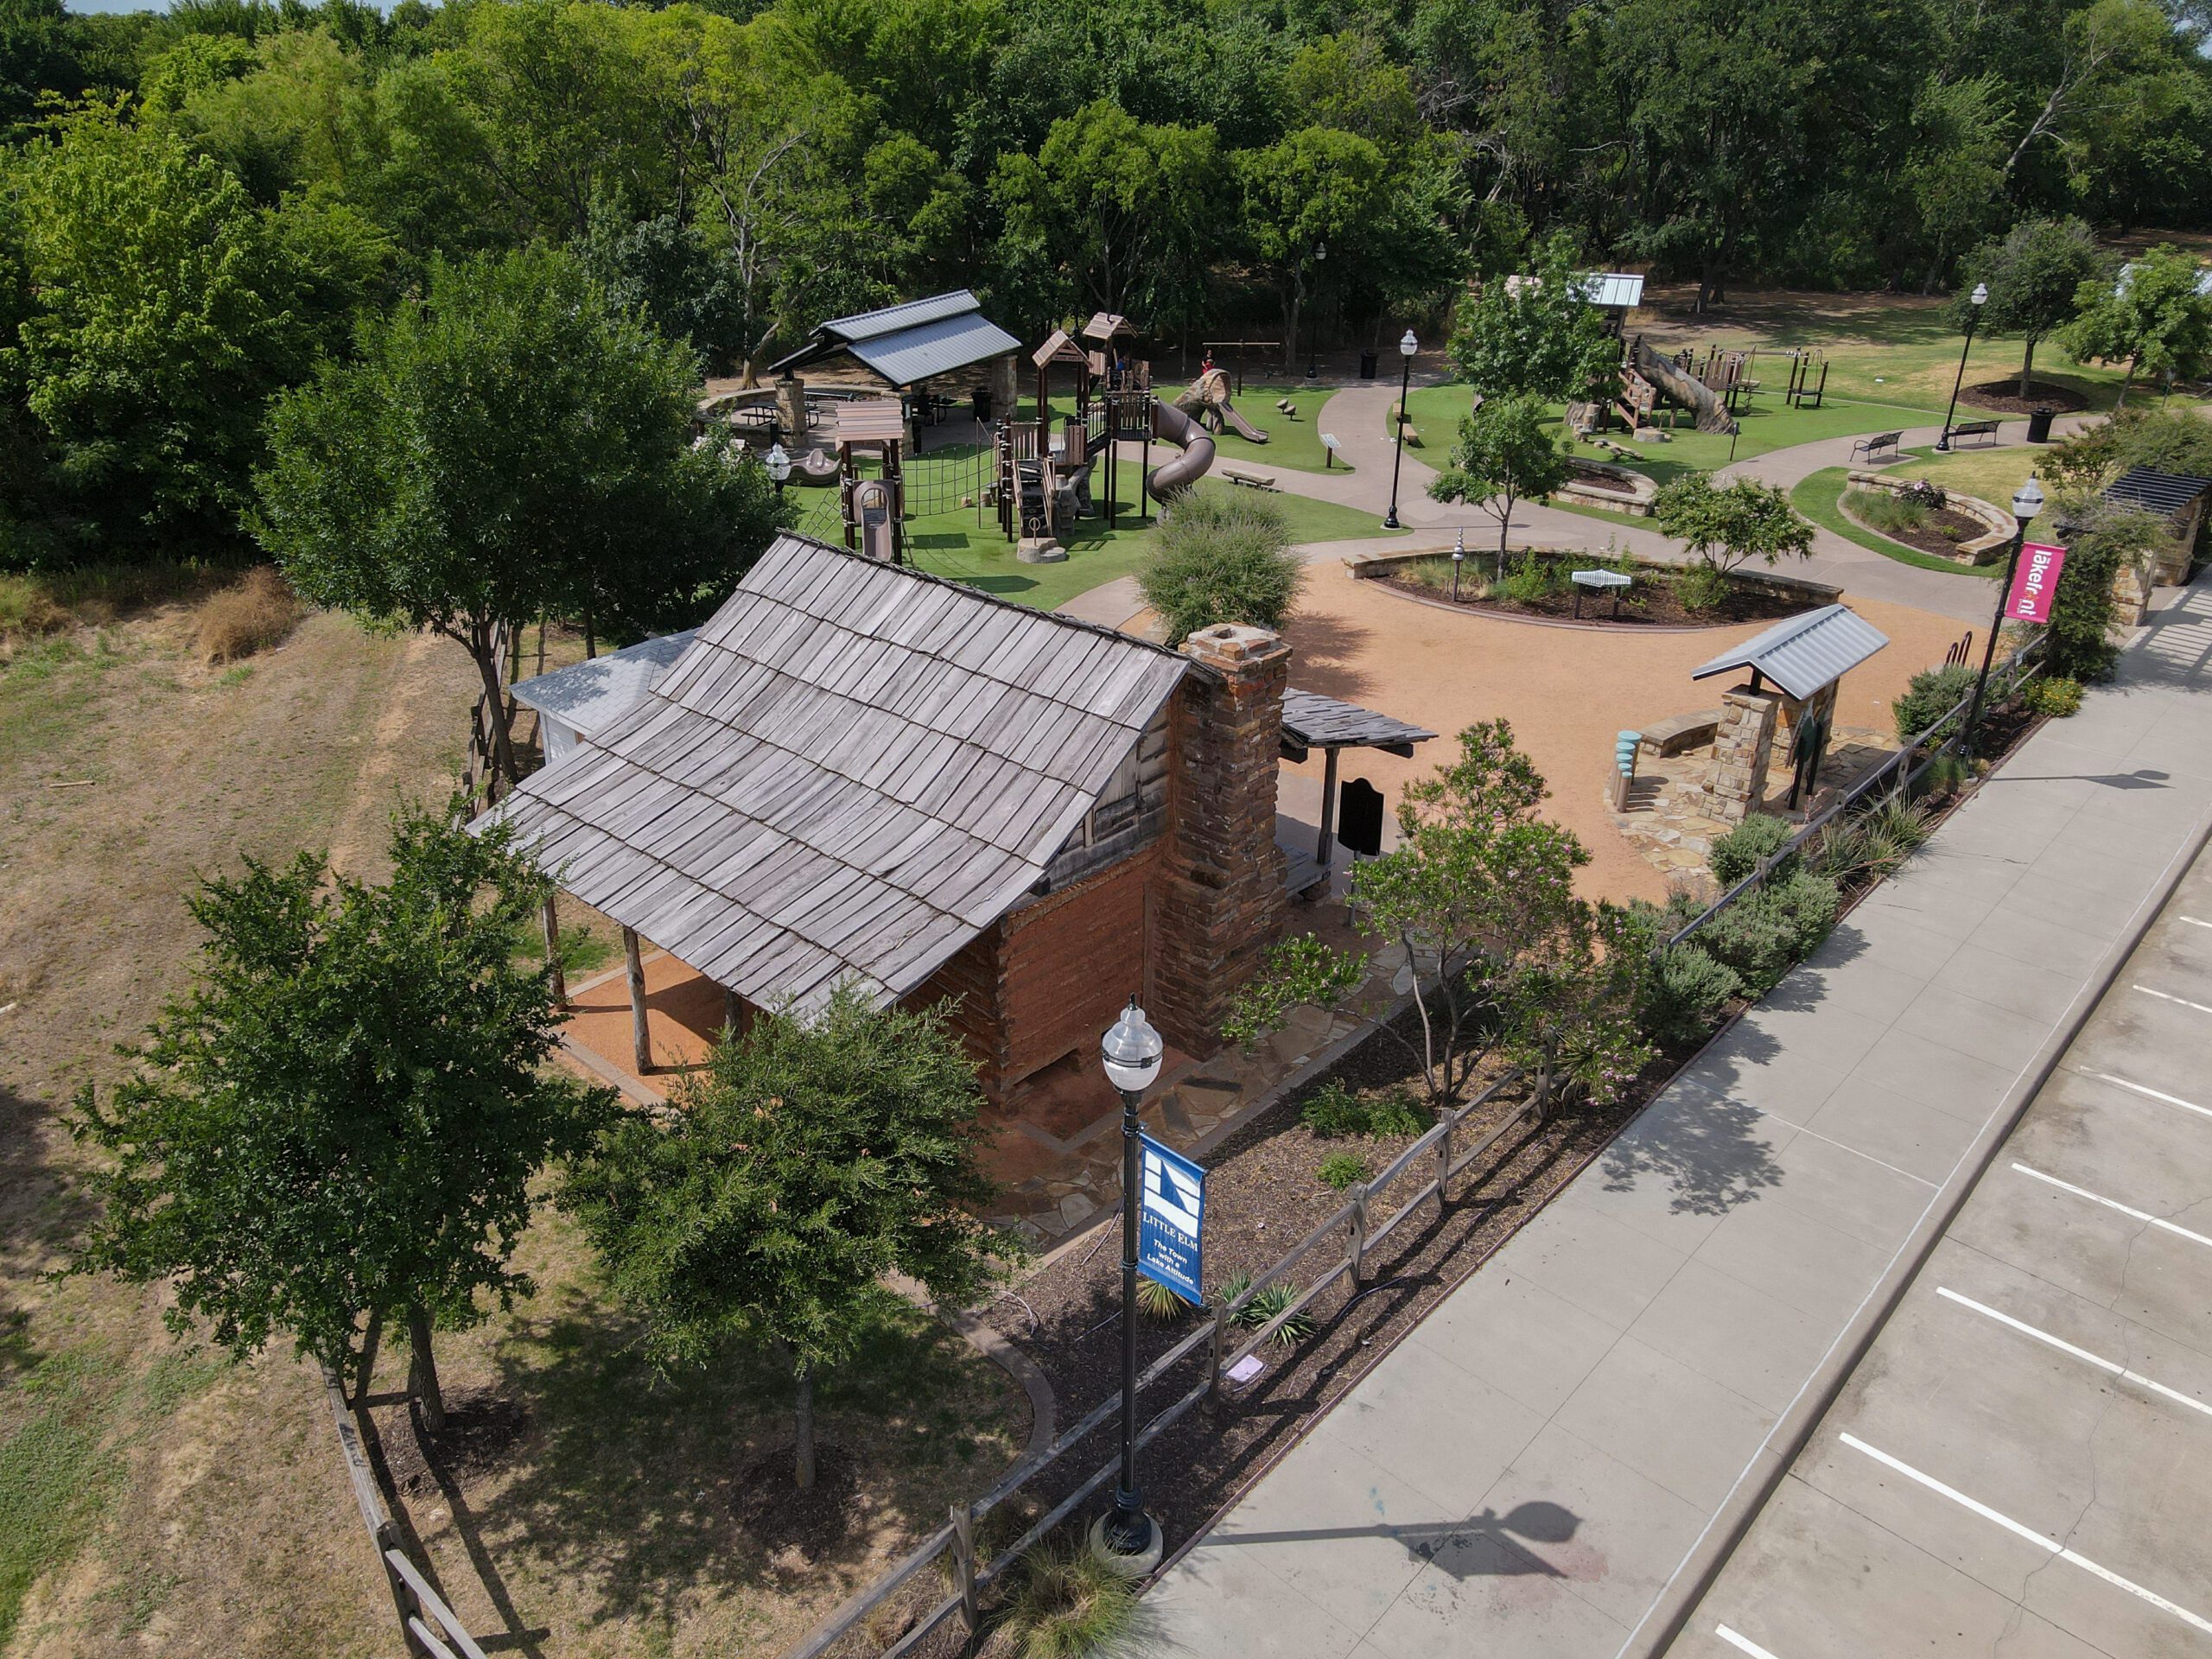
Located in Denton County, the town’s history stretches back to the 1840s. Named because it looks like a little Elm Tree from above, it sits right on Lewisville Lake, which make water sports, boating, and fishing very popular.
Little Elm hosts its own party around Mardi Gras, and includes road races, live music, and of course a crawfish boil.
And year-round, families like living there because of the excellent schools, variety of shopping, dining, and entertainment options. Like most Texas locations, it has seen population growth during the past couple of decades and hovers around 60-thousand.