Search Results for: {search_term_string}/hilti-north-america/hilti-north-america/page/5/alkami - Say Yes to Dallas Search Results for: {search_term_string}/hilti-north-america/hilti-north-america/page/5/alkami - Say Yes to Dallas

McKinney

City of McKinney

In a sea of new building, McKinney is an island of character.  Not that it doesn’t have plenty of new growth…it does. But the authentic, refreshed Town Square dotted with quirky shops and inventive eateries kept bustling with events plus a large, well persevered Historic District, and inventive concept new neighborhoods set it apart from the surrounding suburbs. It’s no accident. The progressive minded city worked with planners to create a city that brought to life all the glory of its past and natural attributes with modern sensibilities to build a community that will thrive well into the future. Money magazine took notice, listing McKinney as the #1 place to live in America for 2014. EastSide – Well-established communities like Eldorado (one of the first master planned communities with over 700 homes and mature trees surrounding a country club) and the 30-block historic district which dates from 1890s and is the second largest Historic District in the state of Texas.

Website: https://www.mckinneytexas.org/


Rowlett

City of Rowlett

The City of Rowlett is on the water and on the move! Situated on beautiful Lake Ray Hubbard, Rowlett, Texas offers convenient access to Downtown Dallas and the Telecom Corridor via the President George Bush Turnpike, Dallas Area Rapid Transit (DART) Downtown Rowlett Station, and Interstate 30.  From unique single-family neighborhoods to transit-oriented developments, Rowlett is seeing developments of all types in every sector of the City.  And with the addition of the nationally-acclaimed Crystal Lagoons® amenity scheduled to open in 2020, Rowlett has as much potential as any community in America.

Website: www.rowlettonthemove.com


A Meaningful, Cultural Experience

City: Dallas

Neighborhood: Oak Lawn

Company/Title: Dallas Summer Musicals, Director of Individual Giving

When did you move here? Where from?
I relocated to Dallas in April 2018. I previously resided in Omaha, where I was the associate director of development, donor relations at Omaha Performing Arts.

Where else have you lived? 
I was born and raised in Pittsburgh and New York City. I went to college and graduate school in the greater Washington, D.C. area.

What made you Say Yes to Dallas? 
I have a BFA in Musical Theatre, an MS in Arts Management and a Certificate of Fundraising Management. The performing arts has always been my passion. With Dallas Summer Musicals’ recent partnership with Broadway Across America, and with one of the largest Broadway touring venues in the country – The Music Hall at Fair Park – the opportunity to relocate to Dallas for a newly created position was one I couldn’t pass up.

How did you choose where to live in the Dallas Region?
Honestly, on a whim! My partner Jimy and I love Oak Lawn because of the walkability to restaurants and nightlife, and because it provides a dog-friendly neighborhood for our three fur babies. It’s also less than 20 minutes, with minimal traffic during rush hour, to my office in Fair Park.

Tell us about your city/neighborhood. What do you like best? What makes it different?
I like that Dallas (and specifically, Oak Lawn) is not only diverse, but also equitable and inclusive. I often say to friends from the northeast that Dallas is the most diverse place I’ve ever lived—including NYC.

What advice would you give to someone who wants to move here?
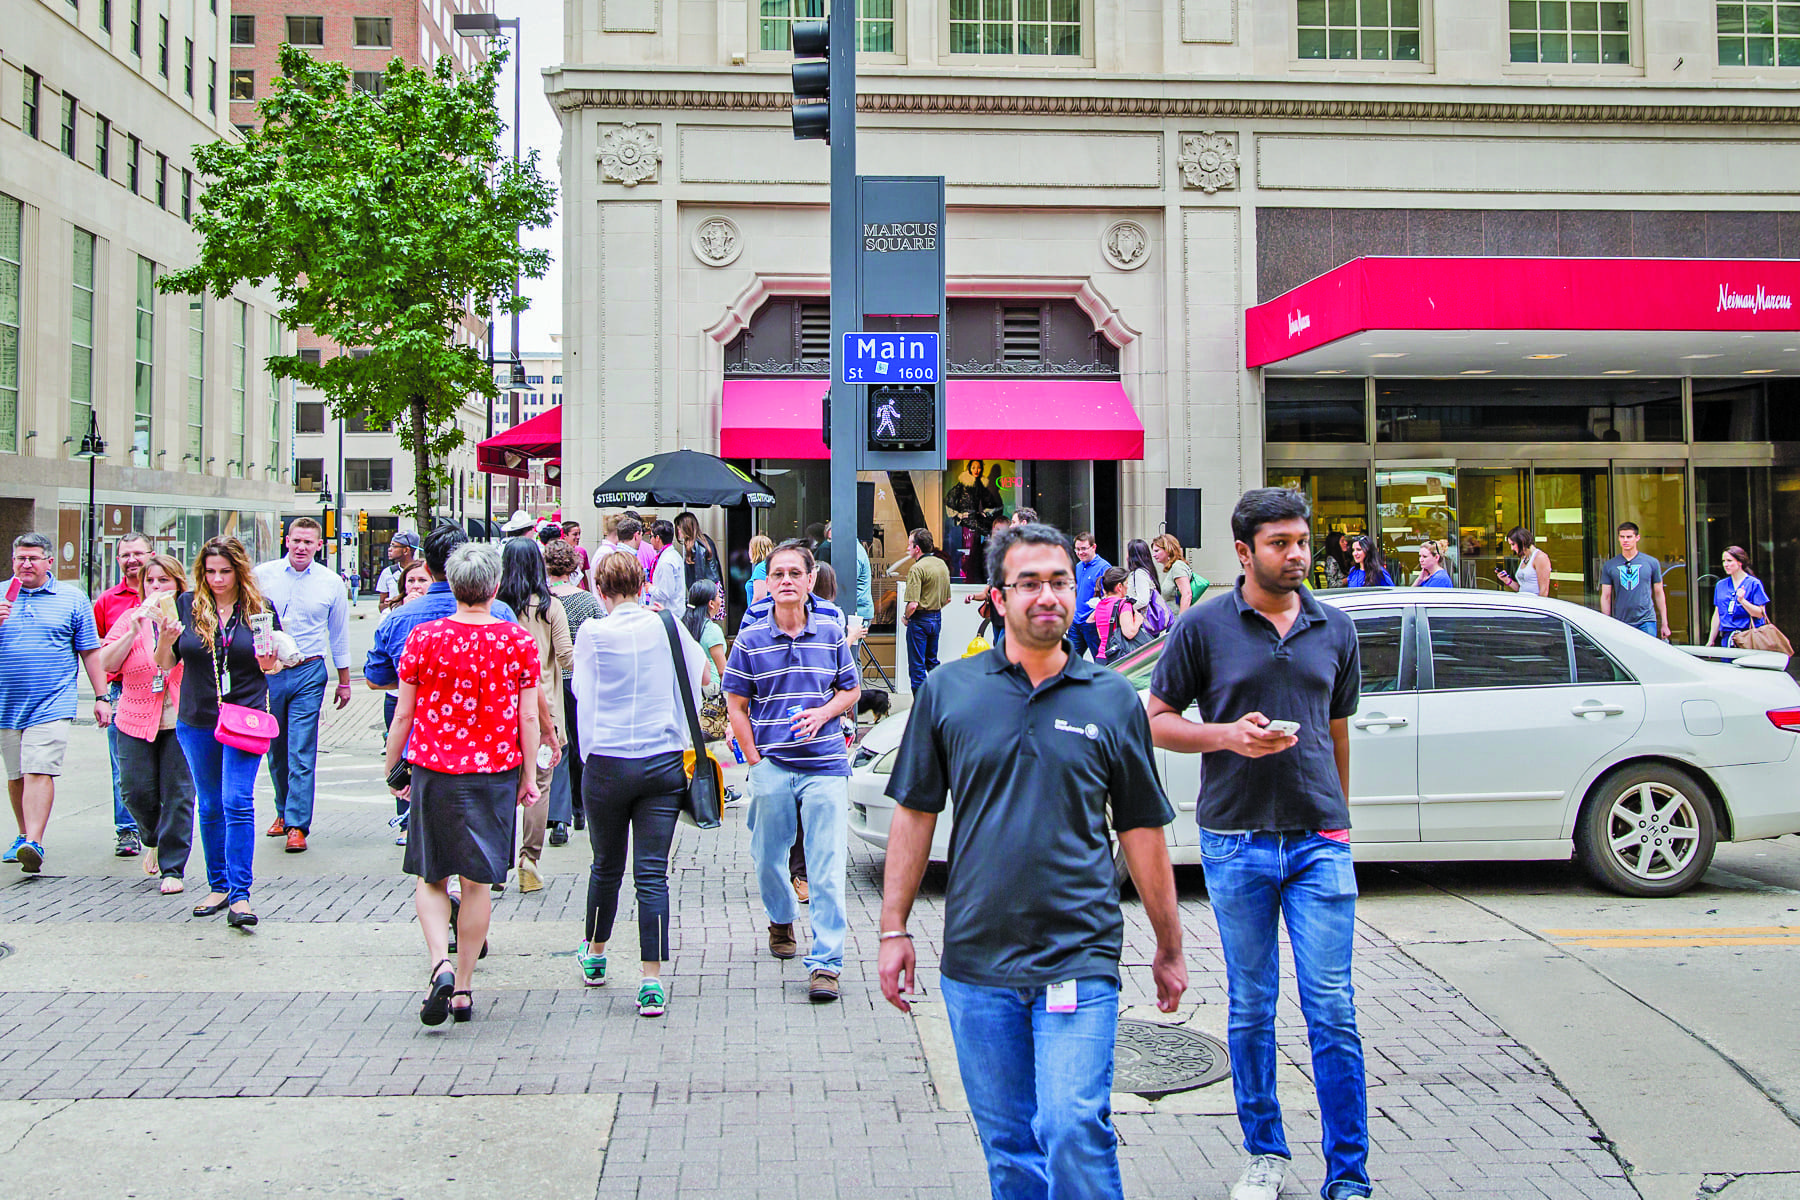
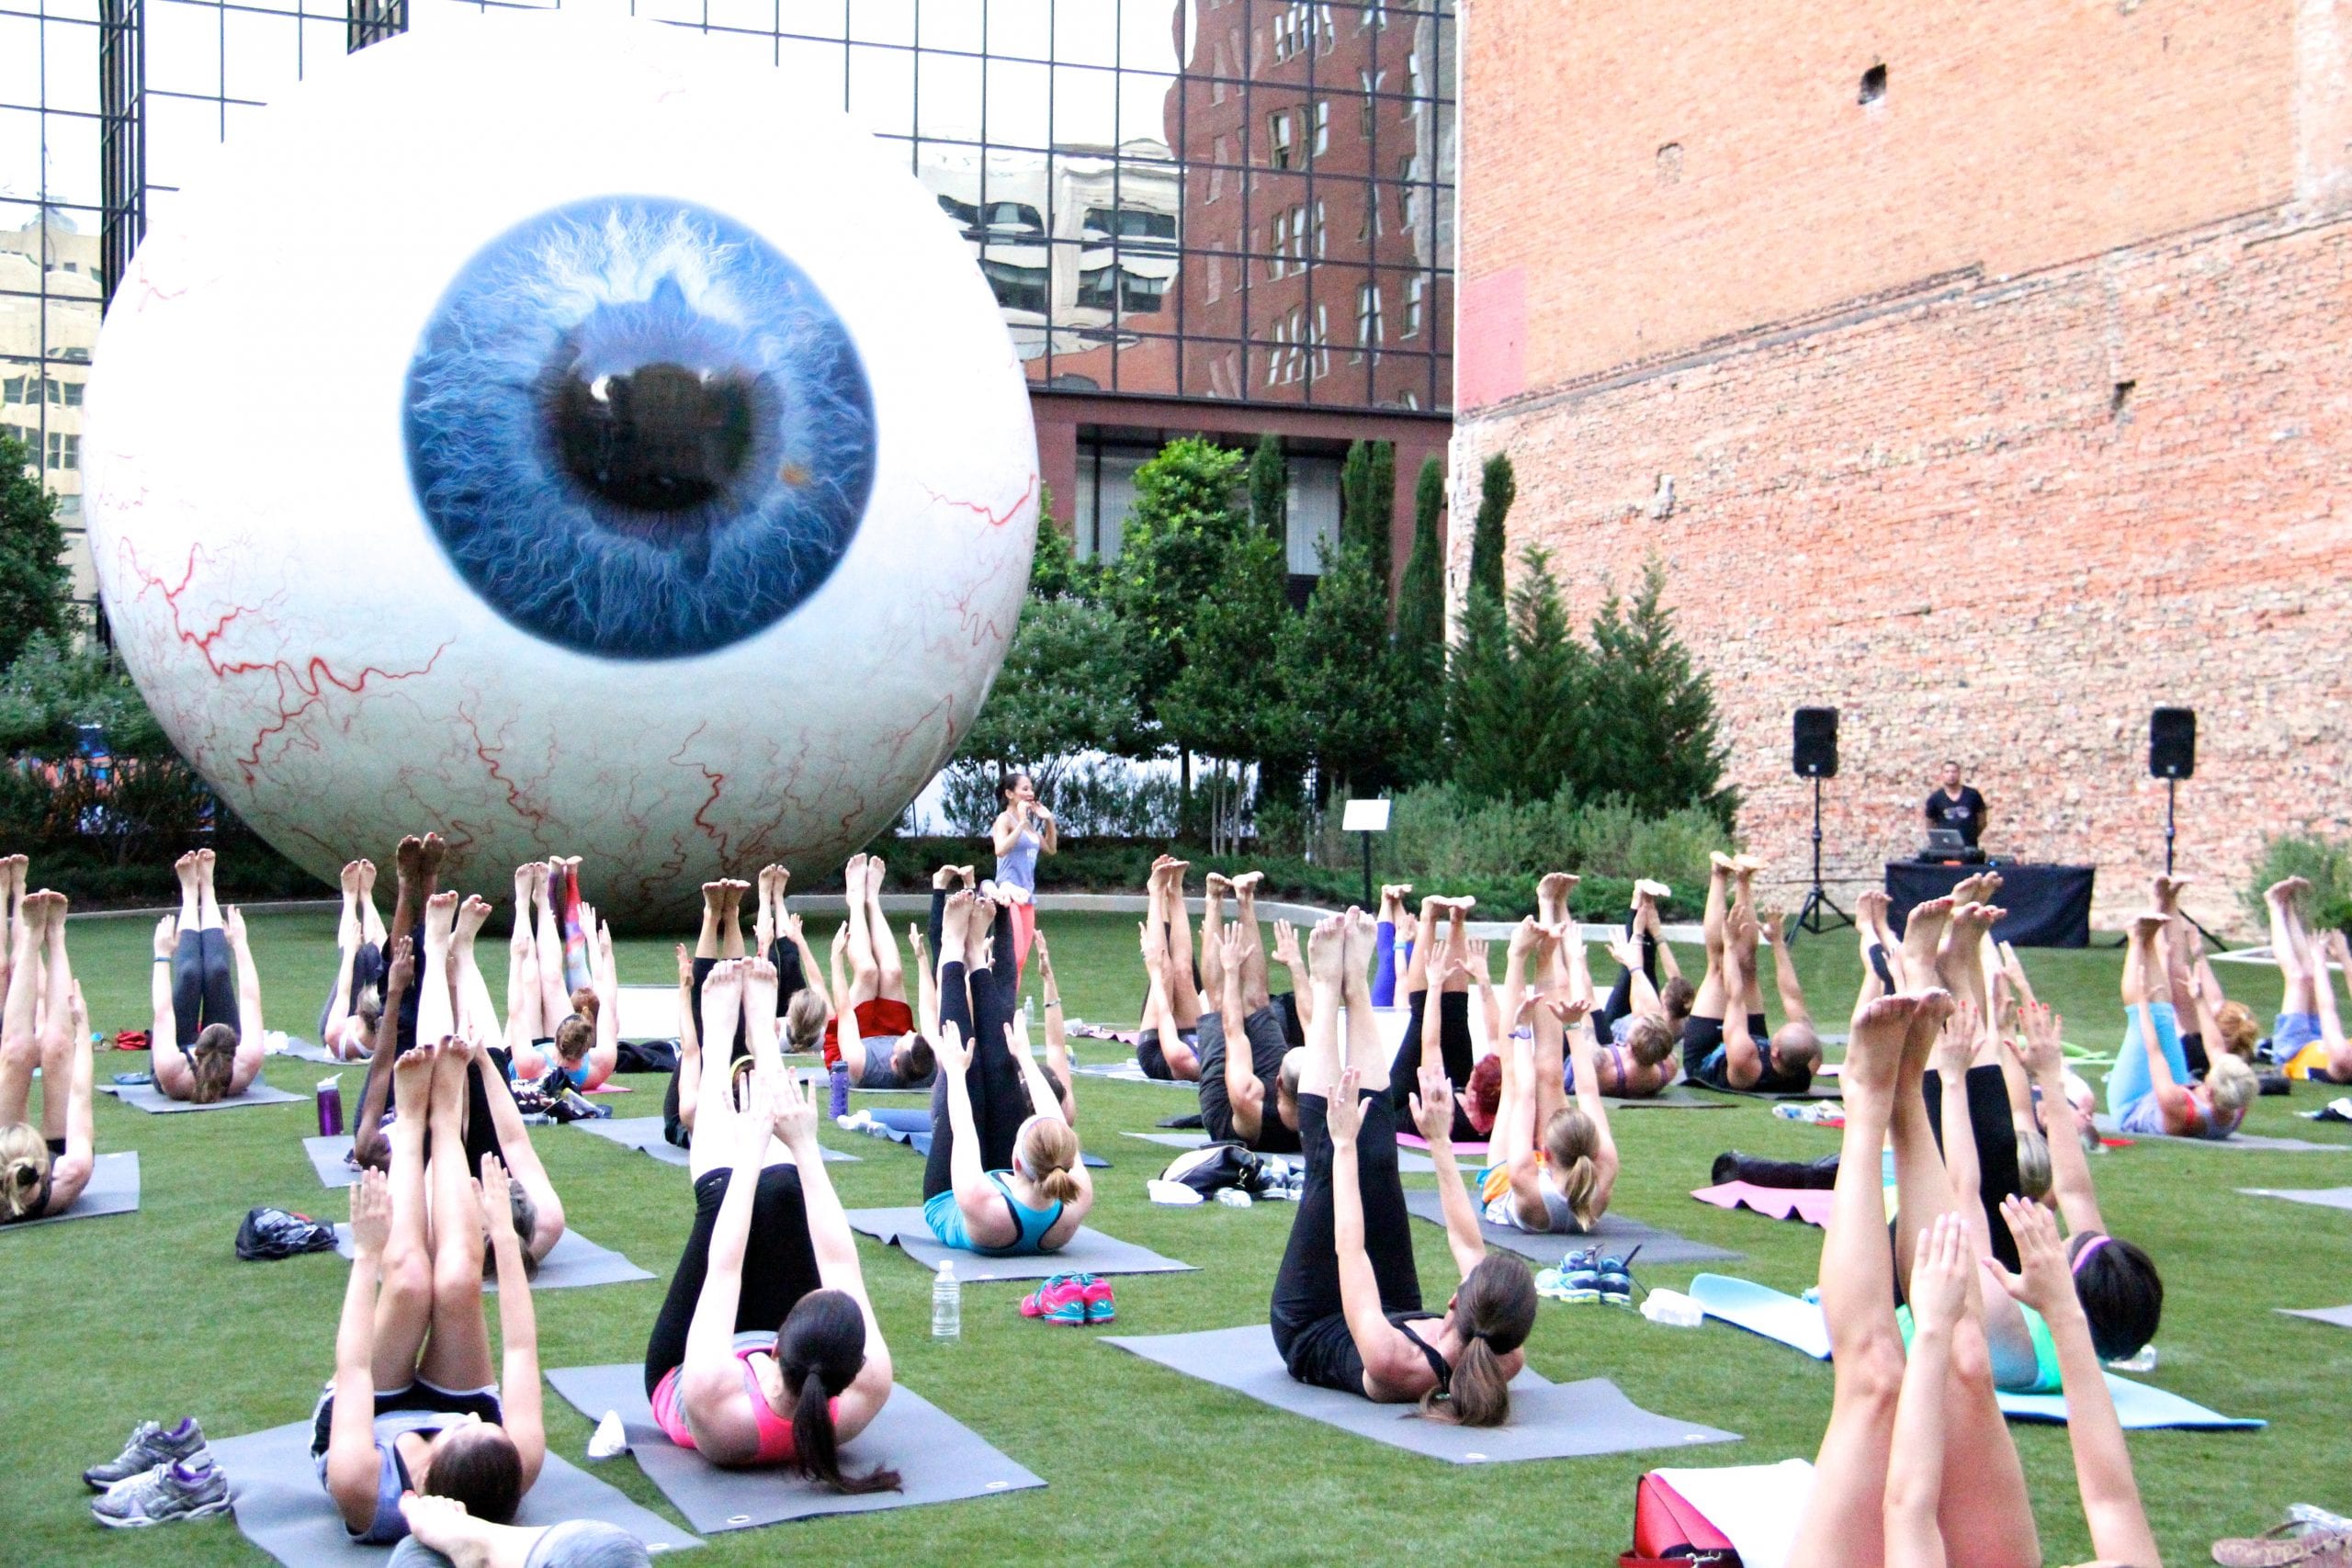
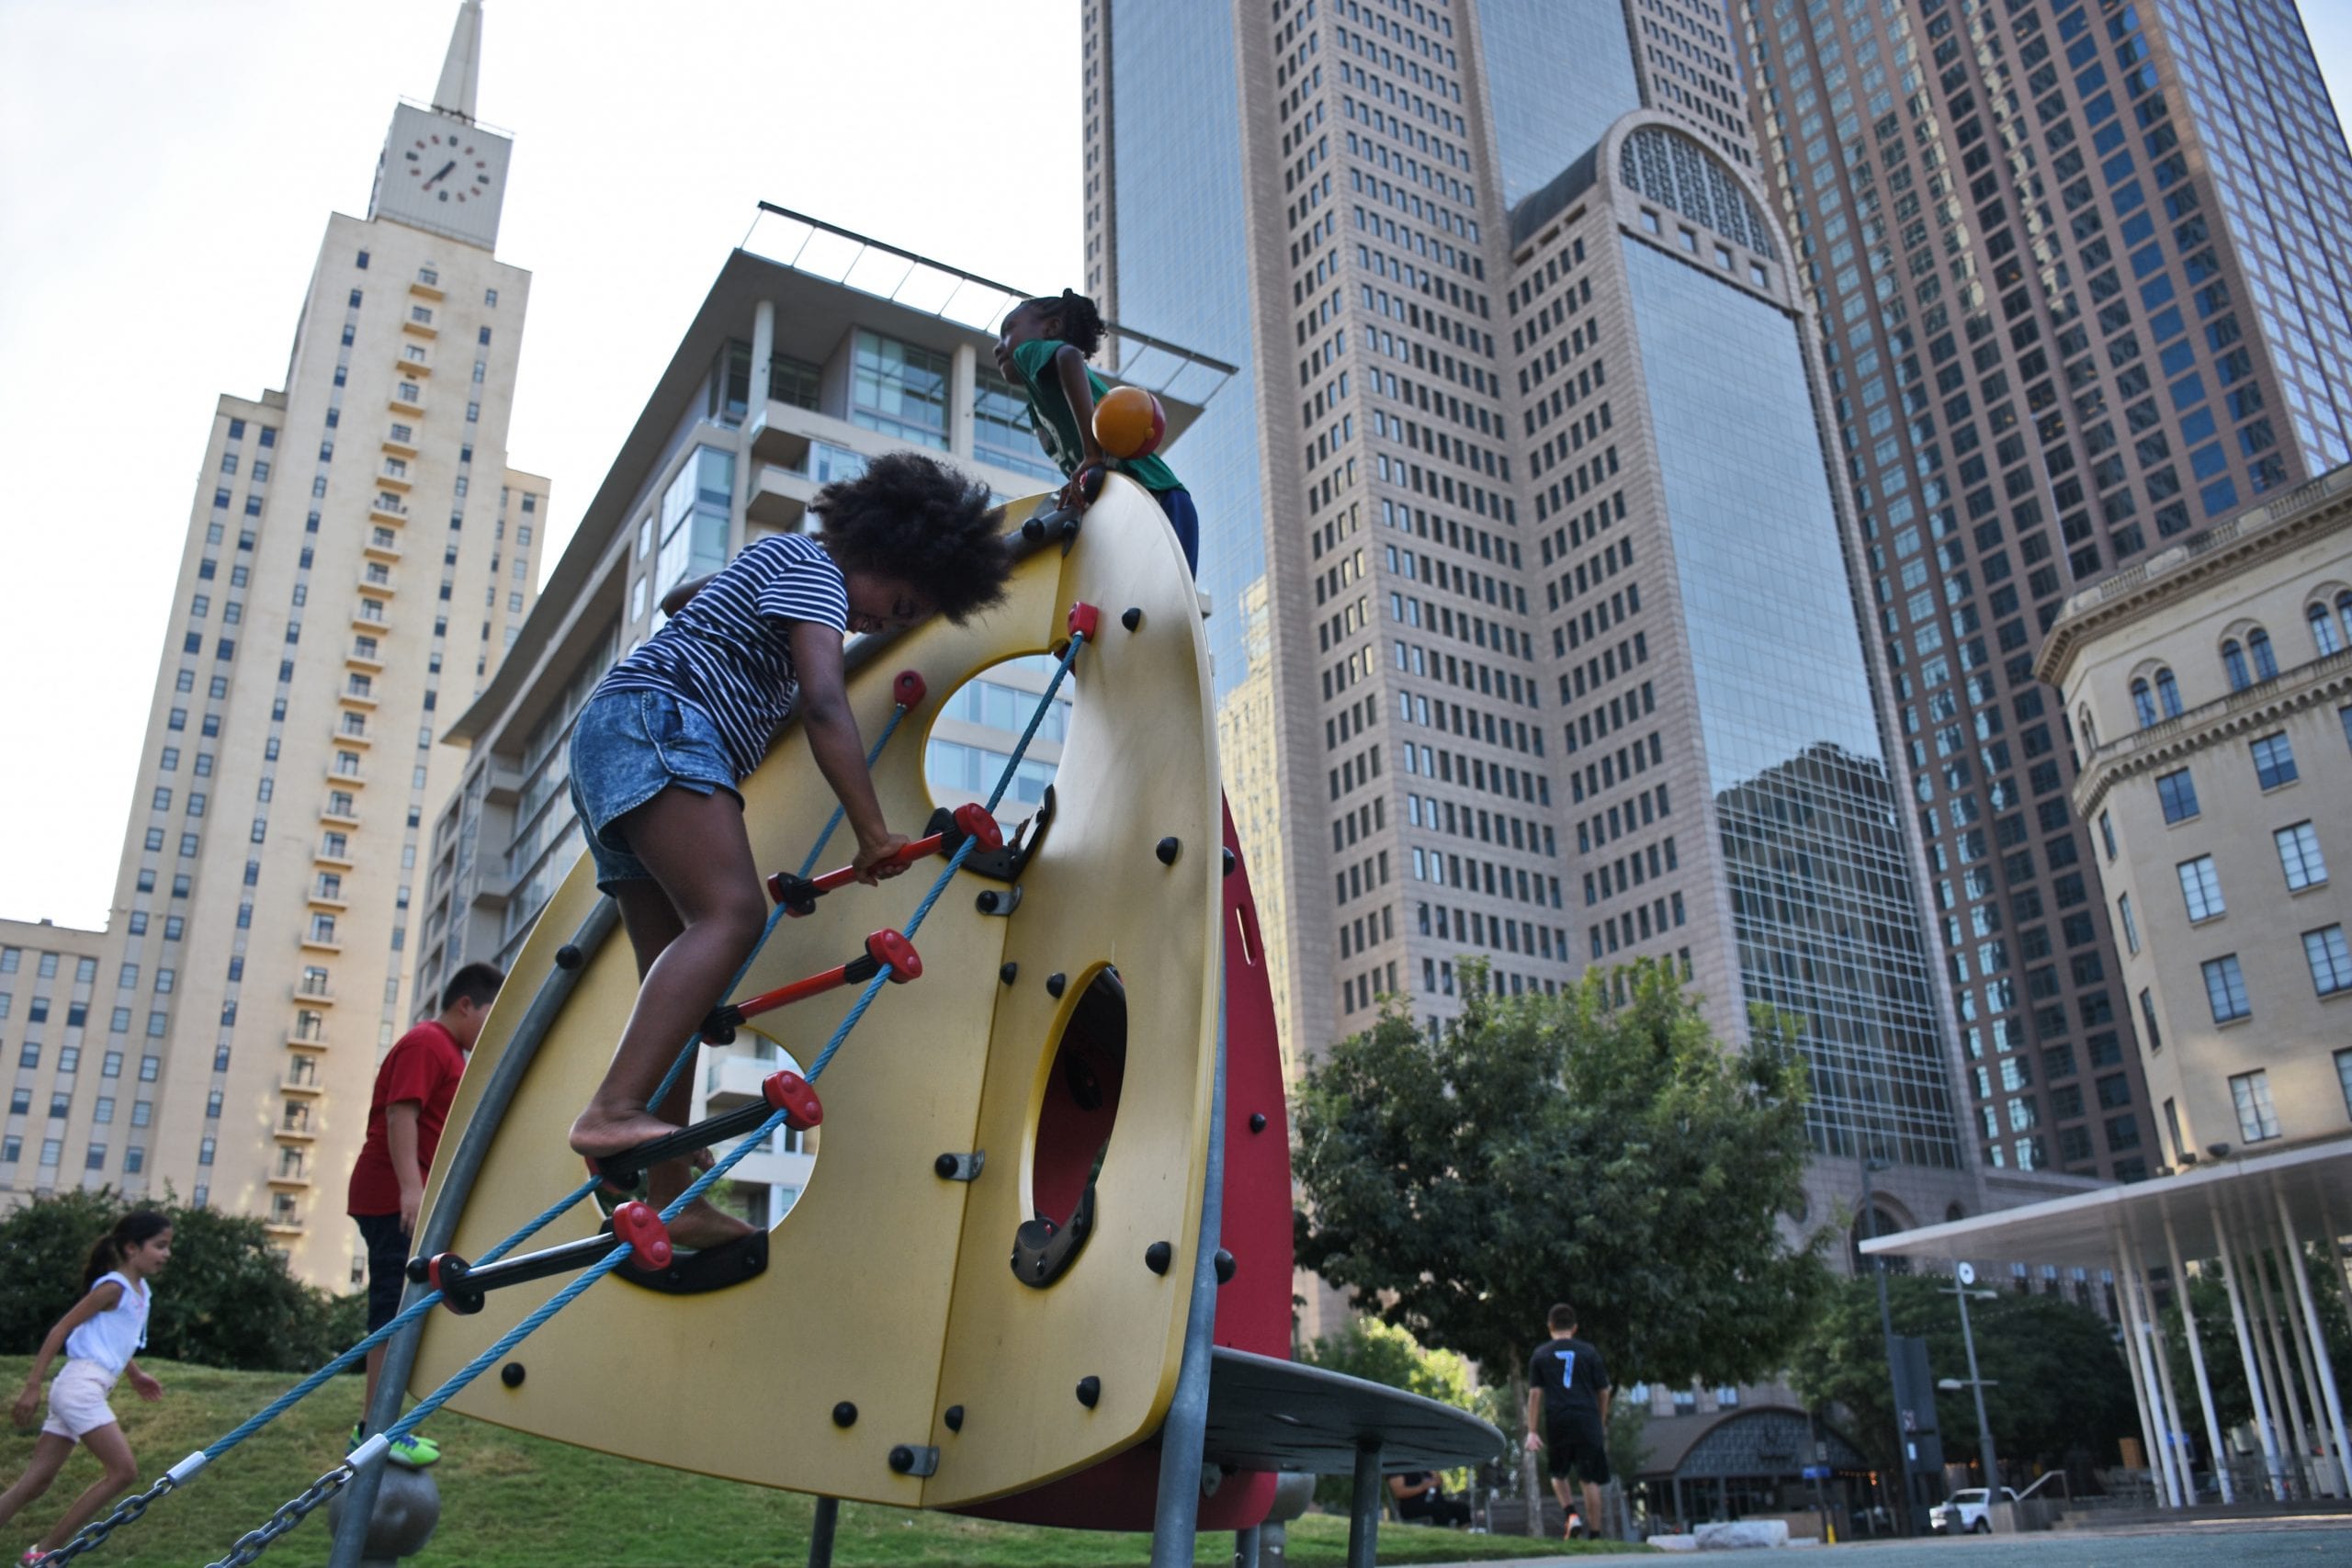
Go out and do something new every chance you get. The museums, arts, food, culture, and recreation are why Dallas is a desirable, economical, cosmopolitan city.

How has your opinion of the Dallas Region changed since moving here?
I really had no idea how expansive the city was. It’s sprawling.

Tell us about the work environment here.
I am passionate about the arts and its role in understanding the human condition. Standing in the back of a dark theater at the end of the day, watching a child’s immersion as they watch “The Lion King” or “Beauty and the Beast” live on stage, makes any work hardship worth it for me.

Where do you go and what do you do on the weekends or days off?
We love to barhop on Cedar Springs or take trips to visit my partner’s mom in Fort Worth.

What is your favorite outside activity, and where is your favorite place to do it?
Walking our three dogs, two dachshunds and a husky mix, in Oak Lawn.

How do you interact with your community?
I love working performances at Fair Park because I see the entire community, coming together, for a meaningful cultural experience. It’s the best.

Do you travel often? Is it easier or harder to do here?
I do! With close proximity to Love Field and DFW, transportation to Pittsburgh and New York City is a breeze.

What would you miss most about the area if you had to leave?
The diversity, equity, and inclusivity of people I interact with every day.

What is your favorite restaurant in the Dallas Region?
We love Paul Martin’s—their happy hour is terrific. We also frequent Street’s Fine Chicken and Orno.


Main Street District

The Neiman Marcus flagship store, Comerica Bank Tower, Bank of America Plaza, The Joule, Magnolia Hotel, The Adolphus, and numerous restaurants combine to form the central space known as the Main Street District. With landmarks such as Main Street Garden, Belo Garden, Stone Street Gardens, and Pegasus Plaza, as well as historic buildings that have been converted to residential buildings, the Main Street District is a great place to live, work, and play.

Downtown Dallas Inc presents Passage | Now through November 3, 2021

Photo: Mike Brooks Commiebike.com

Check out this interactive, free and open to the public art piece called Passage to Main Street Garden! This Instagram-worthy spot, located in downtown Dallas’ Main Street Garden, consists of a tunnel of 20 circles of light that activate with animations and sound as you walk through.


Measuring Impact

Measuring Impact

Setting ambitious and attainable goals requires data that show the starting point and progression. Establishing a metrics strategy for DEI efforts within your organization is a critical piece of any organization’s DEI journey.​

40%

Companies that do not have metrics to measure the success of their diversity and inclusion efforts.1​

9%

Higher EBIT margins in companies with higher than average diversity.2

How might my organization track and use key metrics? 

  • Use the Sample Metrics in the section below as a start and determine your comparison set (e.g., previous year, industry, internal departments, etc.)​
  • Collect data through different approaches such as those listed in our Building Capacity for Measurement section​
  • Leverage data analysis tools like Accenture’s Workplace Accountability Resource Experience (AWARE) enable leaders to use data to define DEI goals, understand how achieving them will deliver quantifiable value, and create a roadmap of initiatives to enable business strategy

Sources: 1 Forbes 2 Harvard Business Review

Sample Metrics

This section contains key metrics to consider as you evaluate your efforts across the talent acquisition process. Please note that this is only one part of a broader ESG strategy, but the intention is to keep this section focused on metrics for the talent pipeline.

Recruitment – Evaluating recruitment efforts allows employers to recognize the efficacy of DEI in their talent acquisition strategy.

  • Return on Investment on recruitment events (money spent vs. applications and/or conversions per event)
  • Return on investment on workforce development partners and sponsorships
  • Applicants and conversions per recruiting contact
  • Assess job descriptions for potential biases 3

Application – Measure data associated with all applicants to analyze information about candidate’s pool to get a sense of success and opportunities to address.

  • Number of applicants​
  • Applicant demographics​
  • Common vs. differentiated skills​
  • Assess job descriptions for potential biases 

Interview – Identifying and reducing potential biases within the hiring process allows employers to get to know the best talent. 4

  • Demographic information of interviewees
  • Background information of interviewees, such as skills, credentials, etc.
  • Demographic information of interviewers

Hiring – Inclusive hiring helps generate employee retention, creativity and overall productivity. Tracking data ensures hiring managers have data to spot trends and potential biases to eliminate.

  • Number of new hires 
  • New hire demographic
  • Percentage of each demographic hired
  • Demographic of each hiring manager 
  • Conversions per interviewer / interview team
  • Acceptance rate of offers per team/hiring manager/recruiter

Employee Experience – Measuring employee experience can uncover bright additions to an employer value proposition and help attract the best talent; it can also give a clear view of opportunities to address for better conversion and retention. 1

  • Level of psychological safety 
  • Level of trust in managers and leaders 2
  • Employee sense of authenticity 
  • Employee sense of inclusion
  • Share of strengths used in role
  • Manager satisfaction
  • Team satisfaction

Representation – Analyzing the distribution of diversity within your organization can help unearth areas to prioritize, create attainable goals for improvement, and provide guidance on areas to explore further.

  • Demographic representation in your firm vs. that of your industry ​
  • Representation in strategic vs. operational roles​
  • Representation in senior vs. middle vs. entry level roles

Pay Equity – Fair and equitable compensation practices show employees your commitment to equity in action. The following data could help determine focus areas to address: 5

  • Salary at each level by demographic and performance ratings​
  • Percentage of employees from underrepresented groups who are below average salary levels​
  • Progress over time in equitable compensation​

Promotion – Companies need to measure the percentage of underrepresented employees promoted each year in comparison to the percentage of majority groups promoted each year.  The data needed will be: 

  • Rate of promotion from women at each grade level 
  • Rate of promotion from underrepresented groups at each grade level ​
  • Promotion information from majority groups at each grade level​
  • % demographic promoted at each grade level

Retention – Companies need to track the attrition rate at each level of seniority to determine where the disconnect if any is happening, employers will need to collect data including: 6

  • Demographic at each level of seniority
  • Percentage of demographics of employees leaving the company to help determine if the attrition rate is possibly an inclusion problem or job satisfaction problem 
  • Exit interview data analyzing job satisfaction 

Sources

  1. https://www.forbes.com/sites/nelldebevoise/2021/07/30/how-ceos-can-keep-their-best-people-through-the-great-resignation/?sh=2211dfcd6077
  2. https://www.accenture.com/us-en/about/inclusion-diversity/culture-equality-research
  3. https://hbr.org/2017/06/7-practical-ways-to-reduce-bias-in-your-hiring-process
  4. https://www.forbes.com/sites/hvmacarthur/2020/07/24/hiring-managers–diversity-how-to-take-the-bias-out-of-your-interviewing-process/?sh=67747e3319b9
  5. https://www.accenture.com/us-en/about/inclusion-diversity/culture-equality-research
  6. https://www.accenture.com/us-en/blogs/voices-public-service/how-can-you-stop-your-employees-from-leaving
  7. https://www.accenture.com/_acnmedia/PDF-134/Accenture-A4-GWC-Report-Final1.pdf

Building Capacity for Measurement​

Many organizations do not have structured data processes to measure the impact of their DEI journey. ​This section provides a starting point and leading practices to consider incorporating.​

Create an iterative process to measure impact

Step 1

Identify business questions to answer with data

Step 2

Identify which metrics to collect in relation to business questions

Step 3

Collect and analyze data based upon metrics identified in Step 2

Step 4

Use insights from data to create and execute plan to achieve desired outcomes

Step 5

Set regular cadence for revisiting data to track and measure progress / impact of plan

What do we want to know?
Determine areas to explore based upon pain points, strengths, and opportunities within organization:

  • Which factors contribute to advancement and retention of our high performers from underrepresented groups?

How will we find it?
Prepare data plan for metrics collection:

  • Identify high performers
  • Examine their experience and background
  • Exposure to opportunities

What did we find out?
Compile and analyze data to identify and draw:

  • Identify high performers
  • Trends
  • Commonalities
  • Extreme differences between selected groups
  • Hypotheses

What can we do about it?
Leverage insights to create objectives and actionable steps:

  • Establish initiatives
  • Change processes
  • Expand learning and development
  • Create partnerships

Did it work?
Establish when and how to assess plan:

  • Success based upon objectives
  • Updates needed
  • Collect more data and metrics
  • Frequency of updates
  • Communicate results

Methods for Measuring Impact

Description: Crowdsourcing collects information, opinions, or work from a group of people. Allowing employees to submit reflections and conducting interviews creates a culture where employees share their thoughts, recognize each other, promote conversations, and encourage learning.1 Many organizations update processes according to crowdsourcing results.

Finding an outlet to voice workers’ frustrations improves retention. A study found that workers who received a phone call or voice intervention requesting their feedback were 20% less likely to exhibit quitting behavior compared to those that did not.2

Case Study: The Department of Defense uses crowdsourcing to find better ways to promote and improve diversity and inclusion. They created a board comprised of Diversity & Inclusion consultants, leadership, and other stakeholders to provide an outlet for employees to submit feedback and raise important topics anonymously. The board acknowledged the “old ways” have taken them far but new ideas from employees are needed to continue the process of inclusion and promoting diversity in the ranks.3 The Board created a Diversity and Inclusion Report with recommendations and clear next steps to implement and track plans.

Sources:
1. Harvard Business Review
2. Forbes
3. US Department of Defense

Description: Track public and employee data at scale to have visibility on demographics, company culture, employee experience, and satisfaction. Assess internal data for disparities using statistical techniques to understand the current state and identify gaps to promote diversity, equity and inclusion within the organization and impact company culture.1
A few internal data trends and metrics organizations assess1:
– gender pay gap
– generation gap
– racial inequities

Case Study: Starbucks pays particular attention to compensation data in their mission to achieve 100% pay equity for women and men. As of March 2018, Starbucks has reached 100% pay equity for partners of all genders and races performing similar work across the USA. Starbucks achieved this milestone by creating equal footing from the start and throughout an employee’s career. They do not ask candidates about their salary history, as their starting pay is based on a candidate’s skills & abilities. They also maintain a culture of transparency and accountability amongst employees, to preserve pay equity globally.2

Sources:
1. Harvard Business School
2. Starbucks

Description: Receive feedback, knowledge and guidance from the individuals leading I&D initiatives and Employer Resource Groups (ERGs) within the organization. Bringing them together not only measures particular focus areas, but increases allyship, collaboration, resources, and productivity. ERGs provide an open forum where all employees with a shared interest are invited to connect and support recruitment, retention, development, and advancement of all forms of diverse talent. Stakeholders include Human Resources and Executive Management spearheading decision making within the organization.

According to research, inclusive teams make better business decisions up to 87% of the time. Teams that follow an inclusive process make decisions two times faster with only half of the meetings. 1 Decisions made and executed by diverse teams also delivered 60% better results. Compared to individual decision makers, all-male teams make better business decisions 58% of the time, while gender diverse teams do so 73% of the time. Teams that also include a wide range of ages and different geographic locations make better business decisions 87% of the time.2

Case Study: Allstate frequently seeks ERG leadership input to ensure they address inclusion and diversity issues internally and externally. They use current ERG relationships with external organizations to enhance the diversity of their hiring pipeline including, National Society of Black Engineers, Society of Women Engineers, Association of Latino Professionals For America, etc. In 2021, 30% of new hires were from underrepresented groups, increased from 19% in 2016.2

Sources:
1. Building Sustainable D&I (Gartner)
2. Allstate

Description: Access vast amounts of data to unlock the true potential of talent, employees, and new sources of growth for organizations.1 Gather real-time, I&D data and desired outcomes by soliciting employee responses in regular large gatherings (i.e. town halls) to measure I&D awareness and consciousness in the organization. Employee feedback is the most useful data source for measuring inclusion, especially when leaders can use a “pulse,” a quick survey, to check in with employees without adding to their workload.2

Recent research shows, 68% feel they create empowering environments—in which employees can be themselves, raise concerns and innovate without fear of failure— but just 36% of employees agree. In addition, employees care increasingly about workplace culture and believe it’s important to help them thrive in the workplace (reported by 77 percent of women and 67 percent of men).3

Case Study: The HEINEKEN Company conducts “climate surveys” to track the evolution of employees’ perception of inclusion.4 HEINEKEN takes time to understand people’s remarks and concerns and act in response. HEINEKEN now offers a female sponsorship program that supports women in their personal development journey across the organization and embeds inclusion and diversity principles throughout its people processes, including external recruitment, promotions, and working practices. Female representation at HEINEKEN has grown over the years from 16% to 23%.5

Sources:
1. Accenture – Decoding Organizational Data
2. Harvard Business Review
2. Gartner (HR)
3. Accenture – Culture of Equality in the Workplace
4. LinkedIn
5. HEINEKEN

DIVERSITY IN TECH HIRING TOOLKIT HOME